Predictive Sales Forecasting: Real-World Implementation and ROI

No time to lose? Summarize with AI
ChatGPT
Claude
What Predictive Sales Forecasting Delivers
Traditional forecasts combine rep estimates, probability percentages, and manager judgment.
The result: biased, backward-looking data that lags reality by weeks.
Predictive AI forecasting operates on continuous data signals.
From Rep-Level Predictions to Executive Rollups
Instead of asking reps "What's your confidence on this deal?", predictive models answer: "Based on 18 months of historical data, similar deals with these characteristics close 73% of the time in 28 days."
Models ingest:
CRM data: Deal stage, amount, age in stage, last activity date Engagement signals: Call frequency, proposal sent, budget confirmed, stakeholder consensus Competitor activity: Mentions in emails, late-stage objections Historical precedent: Win/loss patterns by industry, ACV, buyer personas Market signals: Economic indicators, industry trends, seasonality
Output: Real-time probability score per deal plus forecasted close date. Instead of vague categories ("Commit," "Best Case"), leaders see: "Deal A: 78% probability of closing Jan 15 at $125K."
Impact on Forecast Accuracy, Slip Risk & Revenue Coverage
Metric | Traditional CRM | Predictive AI | Improvement |
Forecast Accuracy | ±12-15% variance | ±3-5% variance | +60-75% better |
Update Frequency | Monthly/quarterly | Weekly/daily | +400% more frequent |
Stall Detection | Reactive (post-stall) | Predictive (2-3 weeks early) | Real-time alerts |
Revenue Variance Q-over-Q | ±20-25% | ±8-10% | +60% variance reduction |
Time to Generate | 4-5 hours manual | <30 minutes auto | 90% faster |
Forecast Audit Trail | Incomplete notes | Automatic; complete reasoning | 100% auditability |
Board impact: Finance teams can now trust pipeline guidance. Hiring plans align with actual expected revenue. Investor confidence improves as revenue variance narrows.
The ROI Model You Can Copy
Predictive forecasting ROI flows from three uplift drivers plus cost inputs.
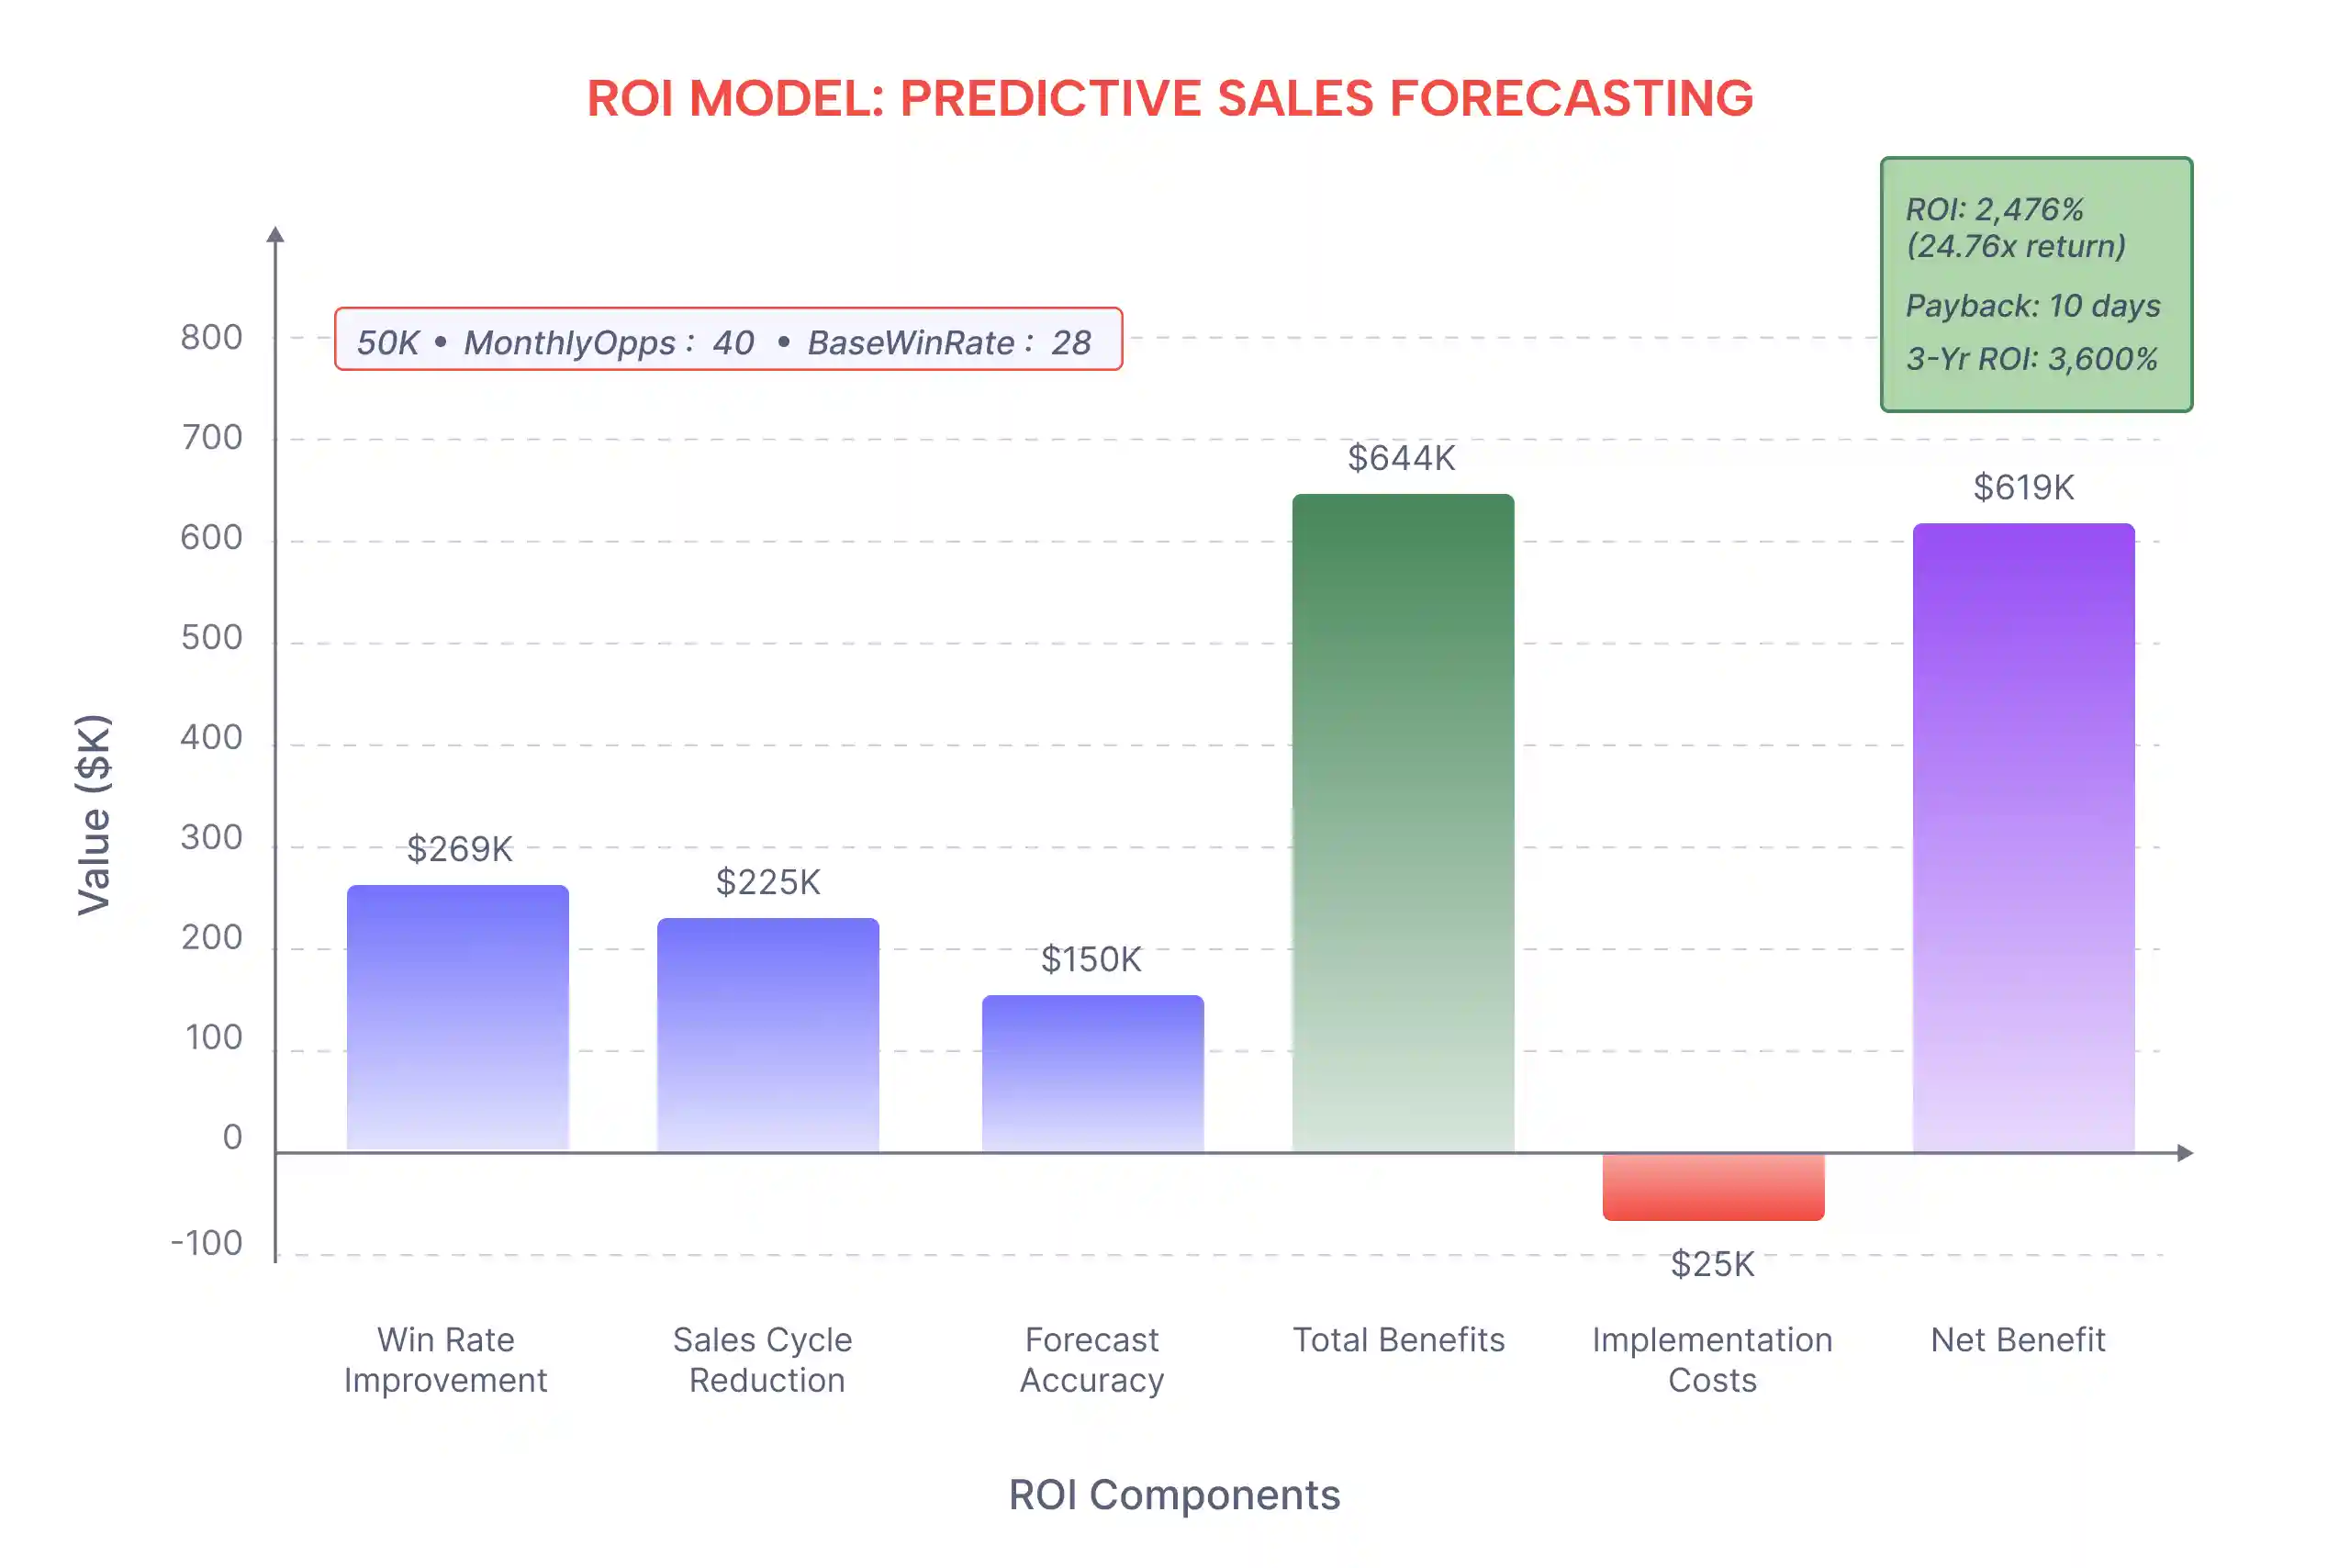
Sample Calculation (10-Rep Team)
Inputs:
Average deal size: $50,000
Monthly opportunity volume: 40 deals
Base win rate: 28%
Average sales cycle: 90 days
Team size: 10 reps
Current annual revenue: $6.7M
Uplift Drivers:
Win Rate Improvement (+4 points = 28% → 32%): Better deal scoring identifies high-probability opportunities earlier. Sales time shifts from low-quality leads to winnable deals.
Additional closed deals per year: 5.4 deals
Revenue impact: $269K
Sales Cycle Compression (-15 days = 90 → 75 days): Earlier risk detection enables faster intervention; predictive next-best-actions keep momentum.
Cycles compress; deal velocity accelerates 1.5 deals/rep/year
Revenue impact: $225K
Forecast Accuracy Gain (±15% → ±5%): Finance reduces pipeline contingency; better resource allocation and hiring timing; CFO confidence eliminates conservative discounting.
Planning value (fewer surprises, optimized hiring): $150K
Total Year 1 Revenue Uplift: $644K
Costs:
Platform license (10 seats @ $100/month): $12,000
Implementation & setup (40 hours engineering): $6,000
Training & change management (20 hours): $3,000
CRM integration & data cleaning: $4,000
Total Year 1 Cost: $25,000
ROI Calculation:
Net benefit Year 1: $619,000
ROI: 2,476% (or 24.76x return)
Payback period: 10 days
3-year cumulative: $1.8M benefit, $50K cost = 3,600% ROI
Cost Drivers & Hidden Expenses
What's NOT included in the above (and why):
Change management resistance: If reps override AI recommendations 50% of the time, uplift decreases proportionally. Invest 2-3 weeks in training and adoption metrics.
Data quality: If CRM data is only 60% clean, model accuracy drops 10-15 points. Budget 2-3 weeks for data scrubbing before model deployment.
Integration complexity: If your CRM is heavily customized or data lives in 5+ systems, integration effort increases from 1 week to 4-6 weeks.
How It Works in Your Stack
Predictive forecasting platforms connect to your existing tech, so no rip-and-replace required.
Data Sources: CRM, Activity, Product Usage, Billing, Marketing
Salesforce/HubSpot integration: All deals, stages, probabilities, and amounts sync automatically. No manual entry.
Activity data: Last activity date, call frequency, email engagement, proposal sent status feed the recency/engagement models.
Product usage signals (for usage-based GTM): API consumption, feature adoption, and active users refine win/churn predictions for expansion deals.
Billing & customer success: For renewal forecasting, subscription status, NRR, support ticket volume, and CSM notes inform at-risk scoring.
Marketing & intent data: Website visits, content downloads, and account-based marketing engagements factor into lead-scoring models.
Models: Opportunity Scoring, Time-to-Close, Forecast Bias Correction
Opportunity scoring predicts close probability (0-100%) and updates weekly based on new signals. Methodology:
Historical stage progression: "Deals in stage X with >6 weeks age have 35% close rate vs. 60% for 2-week-old deals."
Stakeholder signals: Budget confirmed + technical sponsor engaged = +15 points.
Competitive signals: Competitor mention in emails = -10 points.
Seasonal adjustment: December closures are 20% lower than September.
Output: Each deal gets a dynamic probability; forecasts update daily without rep input.
Time-to-close prediction estimates close date (vs. rep guess). Regression model learns:
Deals in "contract review" stage with high engagement close in 14 days (historical median).
Deals in "evaluating" stage close in 35 days.
Stalled deals (no activity 21+ days) extend by 10 days per week of stall.
Output: Predicted close date for each opportunity; variance from forecast flags risk.
Forecast bias correction removes rep optimism. Traditional rollup: Reps submit commit forecasts; managers add 10% skepticism. Predictive model:
Compares each rep's historical forecast vs. actual close rates
Applies personalized bias adjustment (e.g., "Rep A over-forecasts 18%; discount her commits by 18%")
Removes subjective negotiations and politics
Result: ±5% variance instead of ±15%.
Rollups: Segment, Geo, Product, Enterprise vs. Velocity
Forecasts roll up by:
Sales rep / team / manager: Daily visibility into individual pipeline health.
Geography: Multi-region orgs forecast North America vs. EMEA vs. APAC separately; seasonal and compliance factors adjust per region.
Product / business unit: Separate forecasts for new business, expansion, and renewal; different close probabilities per segment.
Enterprise vs. velocity: Large deals ($500K+) may require executive override; velocity deals trust the model. Policies define thresholds.
Forecast method comparison: Pipeline method vs. historical method vs. AI method run in parallel; each has confidence intervals. Executive decides which to commit to.
Governance: Overrides, Audit Trails, Explainability
Human-in-the-loop: Sales reps and managers review AI recommendations, can override with documented reasoning. "I'm overriding the model because we just won the competitor" is logged.
Audit trails: Every forecast change is tracked with reason (deal slip, new activity, rep override, system adjustment). Finance can trace back why forecast changed.
Explainability: For each deal, the system shows: "This deal is 65% likely to close because it's 4 weeks in contract stage (historical close rate: 68%) and the CTO attended the last call (+5 points for stakeholder consensus)."
Escalation policies: Deals >$500K or at-risk commits require manager approval before forecast lock.
30-Day Rollout Plan (How-To)
Enterprise implementations succeed with phased rollout, not big-bang deployment.
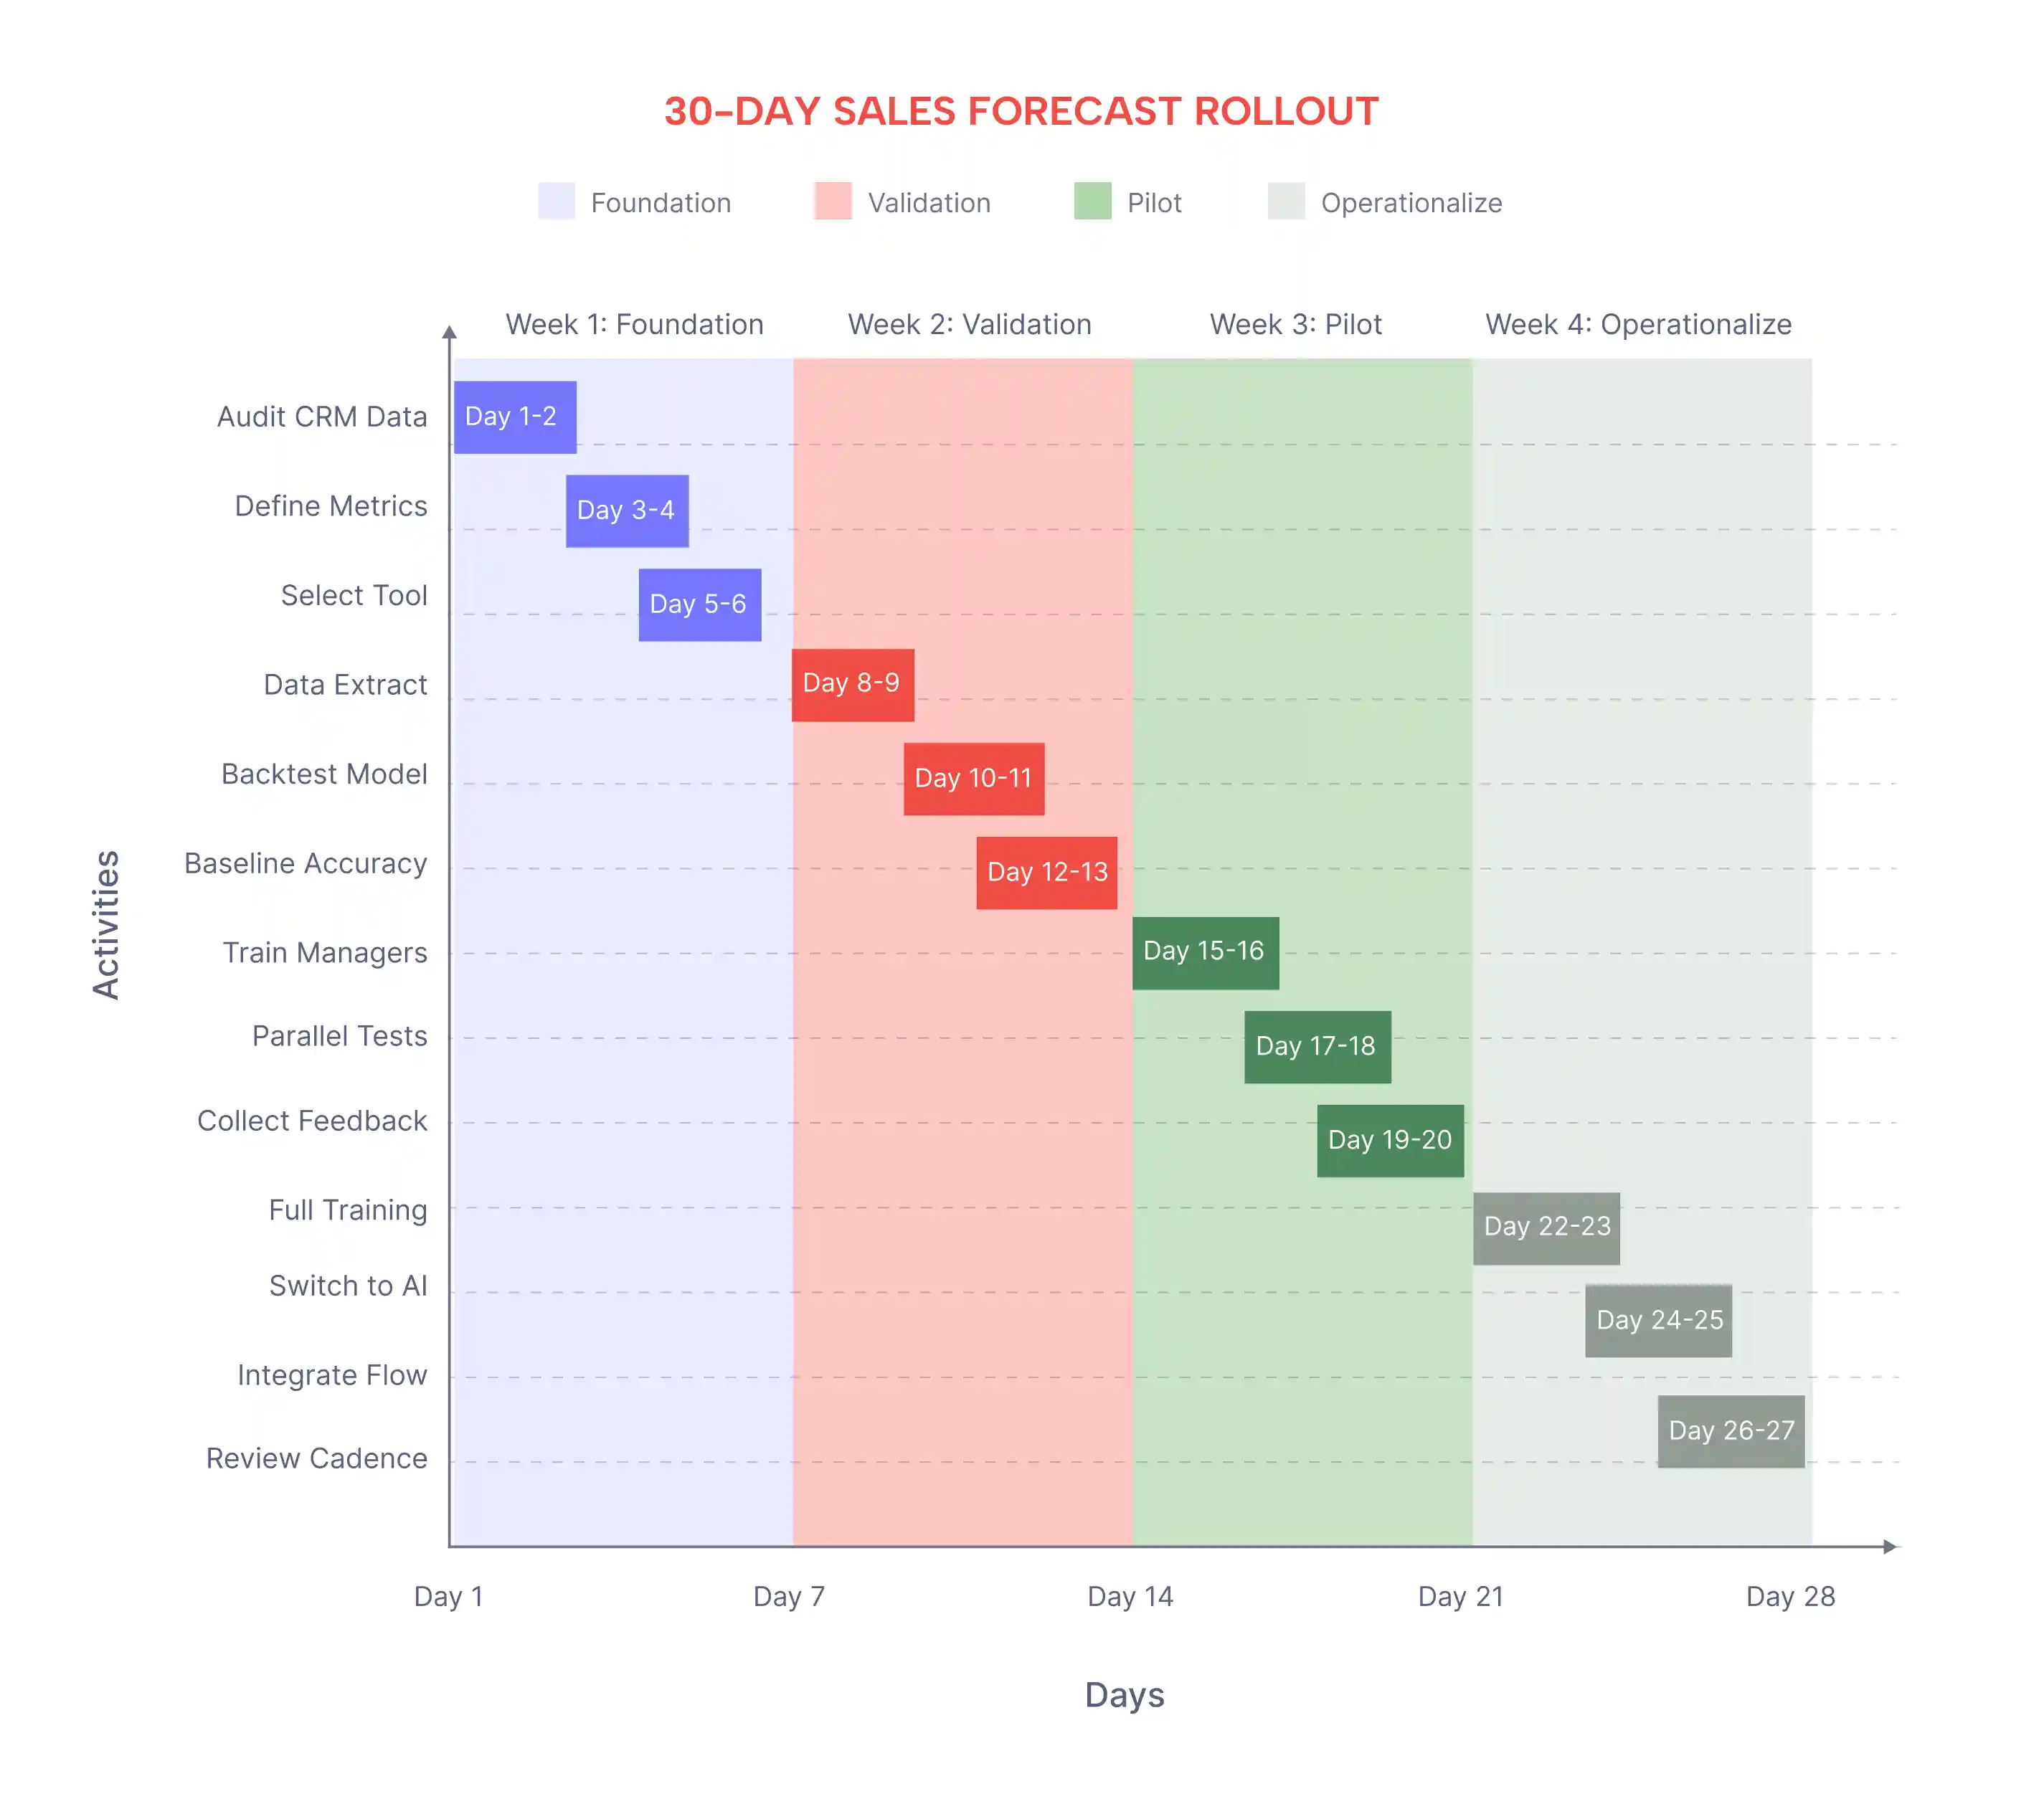
Week 1: Data Readiness & Scope
Days 1-2: Audit CRM data quality. Check for:
Missing deal amounts or stages
Duplicate records
Stage flow compliance (are deals progressing normally, or stalled?)
Activity data completeness (% of deals with calls/emails logged)
Days 3-4: Define forecast metrics and KPIs:
Win rate by segment (SMB, mid-market, enterprise)
Average cycle time by stage
Stage probability (% of deals that progress from stage X to stage X+1)
Rep-level bias (each rep's forecast accuracy track record)
Day 5: Select forecasting vendor; negotiate contract terms (data residency, security, SLA).
Deliverable: Data readiness report (80% data quality target); signed SOW.
Owner: RevOps + Finance. Risk: Data issues delay model training by 1-2 weeks.
Week 2: Model Fit, Backtests & Baselines
Days 1-2: Data extraction and cleaning. Standardize:
Deal stage naming conventions
Probability assignment rules
Activity logging (call = 1 touch; email = 0.5 touch)
Remove anomalies (one-time wins, major discounts)
Days 3-4: Backtest AI model on 12 months of historical closed deals. Does it correctly predict which deals actually closed?
Backtest accuracy target: >85% (model correctly predicts close/no-close for 85%+ of historical deals)
If lower, refine inputs or extend training period
Day 5: Establish baseline using current forecasting method. Document today's ±% variance. This is the benchmark you'll compare against.
Deliverable: Model backtest report; baseline metrics locked in.
Owner: Analytics + Vendor. Risk: Inconsistent historical data lowers backtest accuracy; may need 3-4 weeks.
Week 3: Pilot with 1-2 Segments & Feedback
Days 1-2: Train 1-2 sales managers on the AI forecast tool. Walk through:
How to read probability scores
How to interpret close date predictions
When to override (and how to document)
How to review audit trails
Days 3-4: Run parallel forecasts on 1-2 segments (e.g., SMB territory or one geo). Side-by-side:
Current forecast method (what you're doing today)
AI forecast (what the model recommends)
Track both; compare accuracy weekly
Day 5: Collect feedback from pilot managers. Refine settings (e.g., adjust sensitivity, override thresholds).
Deliverable: Pilot results; feedback-refined model settings.
Owner: Sales leadership + Vendor support. Risk: Low adoption if UI is complex; budget extra training time.
Week 4: Full Rollout, Targets & Cadence
Days 1-2: Train full team. Show:
How the new forecast works (5-minute explainer for reps; 30-minute deep dive for managers)
How it impacts their daily work (more accurate leads, better deal prioritization)
New forecast call workflow
Day 3: Go live with AI forecast for all segments. Switch from manual commit to AI-driven commit.
Day 4: Integrate into weekly forecast call. Agenda:
Review AI forecast vs. prior week (what changed? why?)
Identify slip risk (deals below 40% probability)
Allocate resources to high-probability deals
Day 5: Establish executive review cadence:
Weekly: Forecast accuracy dashboard (actual vs. forecast, variance %)
Monthly: Deep dive into misses (why did we miss forecast by 8%? What signals did we miss?)
Quarterly: Model accuracy review and retraining
Deliverable: Live forecasting workflow; governance playbook; executive dashboard.
Owner: Sales ops + All leadership. Risk: Change resistance; reps override AI recommendations. Mitigate with clear communication on why model exists (not to replace them, but to support faster, better decisions).
Integrations & Change Management
Salesforce / HubSpot Integration Checklist
Before connecting your CRM:
API user account created with appropriate permissions
Field mappings defined (how does "deal stage" map between CRM and forecasting tool?)
Sync frequency set (real-time vs. hourly vs. daily)
Data encryption configured (TLS for API calls; encryption at rest for stored data)
Backup plan documented (what if sync fails?)
After integration:
Run initial sync; verify deal counts match
Spot-check 20 deals for data accuracy
Monitor sync logs weekly; alert if sync fails for >2 hours
Document any CRM customizations that break data mapping (e.g., custom stage names)
Pipeline Hygiene Automations & Guardrails
Dirty data kills forecast accuracy. Automate hygiene:
Nightly data validation:
Flag deals missing required fields (amount, stage, close date)
Alert if deal age-in-stage exceeds 120 days (stall flag)
Deduplicate records automatically where possible
Standardize stage names (prevent "Contract Review" vs. "Contracts" inconsistency)
Weekly hygiene reports:
Data quality score by rep (% of required fields complete)
Top issues: missing close dates, duplicate accounts, stage flow violations
Share with managers; hold reps accountable
Guardrails:
Forecast commit locks 5 business days before close (prevents last-minute gaming)
Deals >$500K require finance pre-approval before forecast inclusion
Export controls: sensitive deals (certain geographies, customers) require compliance review before forecast distribution
Forecast Call Workflow with AI Insights
New weekly forecast call flow (30 mins vs. 90 mins previously):
Dashboard review (5 min): AI forecast dashboard displayed; compare this week vs. last week. What changed? Why?
Slip risk review (10 min): Highlight deals below 40% probability. What's causing slip? What's the next action?
Resource allocation (10 min): Based on AI probability scores, where should we focus reps? High-probability deals? Or at-risk deals needing intervention?
Forecast lock (3 min): VP Sales confirms commit forecast for finance. Done.
Information shared in real-time:
Deal-by-deal probability scores and predicted close dates
Stalled deal alerts (no activity 21+ days)
Forecast variance explanation (e.g., "Forecast down $500K from last week due to Deal A slipping from Contract to Evaluating")
At-risk rep metrics (reps whose forecasts historically over/under-forecast)
Result: 60 minutes saved per week per leader; better informed decisions.
Buyer's Guide & RFP Checklist
When evaluating predictive forecasting vendors, ask:
12 Critical Questions
What data sources do you ingest? (CRM only, or activity, product usage, enrichment data?) Why: Richer data = better accuracy.
What's your backtest accuracy on our historical data? (Ask vendor to run 2-4 week pilot; show accuracy on your own deals, not generic benchmarks.)
How often do forecasts update? (Real-time, hourly, daily?) Why: Weekly or daily updates catch deal slips early; monthly is too slow.
Do you support forecast overrides with audit trails? (Reps will override; system must log why.) Why: Governance + learning.
What's your data residency policy? (EU data in EU; regulated data in HIPAA-certified servers?) Why: Compliance for regulated industries (finance, healthcare).
How do you handle CRM customizations? (Custom stages, fields, workflows?) Why: Many CRM implementations heavily customized; generic integrations fail.
What's the implementation timeline? (30-60 days? 6 months?) Why: Time-to-value matters. Quick wins build momentum.
What training and change management support do you provide? (Onboarding calls? Sales manager playbooks? Adoption tracking?) Why: 70% of forecasting implementations fail due to poor adoption, not poor models.
How do you address forecast gaming? (Can reps easily override? Does system flag suspicious patterns?) Why: Guardrails prevent reps from gaming AI (entering fake deals, inflating probabilities).
What's the cost model? (Per-seat? Usage-based? Platform fee?) Why: Understand TCO; watch for hidden integration or support costs.
Do you provide explainability? (Can you show why deal X is 60% likely to close?) Why: Reps won't trust a black box. Transparency builds adoption.
What's your SLA and support response time? (24/7? Business hours?) Why: Critical systems need responsive support.
Security, Privacy & Data Residency
Security criteria:
SOC2 Type II certification (for all customers)
HIPAA compliance (if handling healthcare data)
GDPR compliance + DPA (for EU customers)
Data encryption in transit (TLS 1.2+) and at rest (AES-256)
Role-based access control (RBAC) + multi-factor authentication (MFA)
Audit logging (immutable, encrypted, retained 7+ years)
Privacy:
Data is never used to train models for other customers (isolation)
Customer can request data deletion anytime
Clear data retention policy (default: 7 years; adjust per contract)
Data residency:
EU customers: Data processed in EU (no US transfer)
US regulated (FINRA, banking): Data in US-only servers
Option to use private cloud / on-premise for ultra-sensitive environments
Total Cost of Ownership (TCO) & Hidden Costs
Typical Year 1 TCO for 10-rep team:
Category | Cost | Notes |
Platform license (10 seats) | $12,000 | $100/seat/month |
Implementation (40 hours) | $6,000 | Data migration, integration |
Training & change mgmt | $3,000 | 20 hours internal time |
CRM data cleanup | $4,000 | Deduplication, standardization |
Year 1 Total | $25,000 | |
Year 2+ Total | $15,000 | License only; minimal maintenance |
Watch for hidden costs:
Integration setup: If CRM heavily customized, add $5-15K
Data quality: If CRM is messy, add $5-10K for deep cleaning
Change management: If sales org resistant, add $10-20K for training/incentives
Consulting: If you want model customization (e.g., custom probability by vertical), add $20-50K
TCO vs. ROI comparison:
For the 10-rep example, Year 1 ROI is 2,476% because benefit ($644K) >> cost ($25K). Even with hidden costs ($25K), ROI remains >1,000%.
Key Takeaways
Predictive AI forecasting moves sales from reactive to data-driven. Accuracy improves from ±15% to ±5%; updates happen daily, not quarterly; deal slip risk is caught 2-3 weeks early.
ROI materializes fast. Win rate improves +3-4 points, cycle time compresses -15 days, forecast accuracy eliminates surprises. 10-rep team ROI: 2,476% in Year 1; payback: 10 days.
Implementation takes 30 days. Data readiness (Week 1) → Model validation (Week 2) → Pilot (Week 3) → Rollout (Week 4). Quick wins build adoption.
Integration is seamless if your CRM is clean. Salesforce/HubSpot connectors are native; data extraction is automated. Budget 1-2 weeks for data cleanup if CRM is messy.
Change management is the #1 risk. Models that predict 85%+ backtest accuracy fail if reps ignore AI recommendations. Invest in training, adoption metrics, and executive sponsorship.
Governance prevents gaming. Audit trails, override tracking, override thresholds, and data residency policies protect against forecast manipulation and compliance violations.
Real implementations show consistent results: Enterprise SaaS +8-12% accuracy lift; mid-market PLG +3-5% win rate & -10-15% cycle compression; industrial B2B -20-30% variance reduction.
FAQ
Q: How accurate is AI sales forecasting?
A: Predictive models achieve ±3-5% forecast variance on cleaned CRM data, vs. ±15% with traditional methods. Accuracy depends on data quality—if 40% of CRM records are missing close dates or amounts, accuracy drops 10-15 points. Start with a data audit.
Q: What data do you need for predictive sales forecasting?
A: Minimum: 12 months of closed-won and closed-lost deals with stage progression, deal amount, and close date. Better: Activity data (calls, emails), engagement signals (proposal sent, budget confirmed), historical win/loss by segment, and external factors (seasonality, competitors). The more signals, the more accurate.
Q: How long to implement AI forecasting?
A: 30 days for phased rollout (weeks 1-4). 10 days to pilot on 1-2 segments; 20 days to go live org-wide. Enterprise implementations with complex CRM customizations may add 2-4 weeks.
Q: Does AI replace forecast overrides?
A: No. AI complements human judgment. Reps and managers review AI recommendations and can override (with documented reasoning). System learns from overrides: "Last 3 deals VP overrode AI below-50% deals, they closed anyway. Adjust confidence interval."
Q: How does AI improve pipeline management?
A: Predictive scoring identifies high-probability deals (focus selling effort here) vs. at-risk deals (intervention needed). Time-to-close prediction highlights stalled deals (no activity 21+ days). Win/loss patterns reveal which segments are winning, which are losing. Result: Pipeline velocity increases 15-20%.
Q: What's the typical ROI timeline?
A: Quick wins (better forecasts, fewer surprises): 8-12 weeks. Revenue uplift (improved win rates, cycle compression): 4-6 months. Full business case (forecast + rep productivity + resource optimization): 6-12 months. Year 1 ROI typically 150-300% for growing teams.
Next Steps: Experience Predictive Forecasting in Action
Transform forecast accuracy, eliminate revenue surprises, and accelerate deal velocity with predictive AI sales forecasting. See how Aviso AI's Forecast Agent analyzes deal signals, predicts close probability and date, and keeps pipeline momentum on track—all with full audit trails and governance guardrails.
[Book a 20-minute forecasting assessment] to see your forecast accuracy today vs. AI-assisted accuracy, understand your data readiness, and get a custom ROI model for your team size and sales cycle.


