How to Improve Sales Forecast Accuracy When Your Pipeline Data Is Working Against You

No time to lose? Summarize with AI
ChatGPT
Claude

Gartner says that over 72% of sales organizations report forecast accuracy below 80%. If you are a sales manager or revenue leader, that number likely tracks with your experience: the forecast you present each week is built on incomplete CRM data, inconsistent rep inputs, and a pipeline view that was already stale before the call started.
What follows is a breakdown of why this gap persists, what a modern forecasting system must actually deliver, and how an AI-native approach can surface the pipeline risks that spreadsheet roll-ups structurally miss.
Why Does Sales Forecast Accuracy Remain Below 80% for Most Organizations?
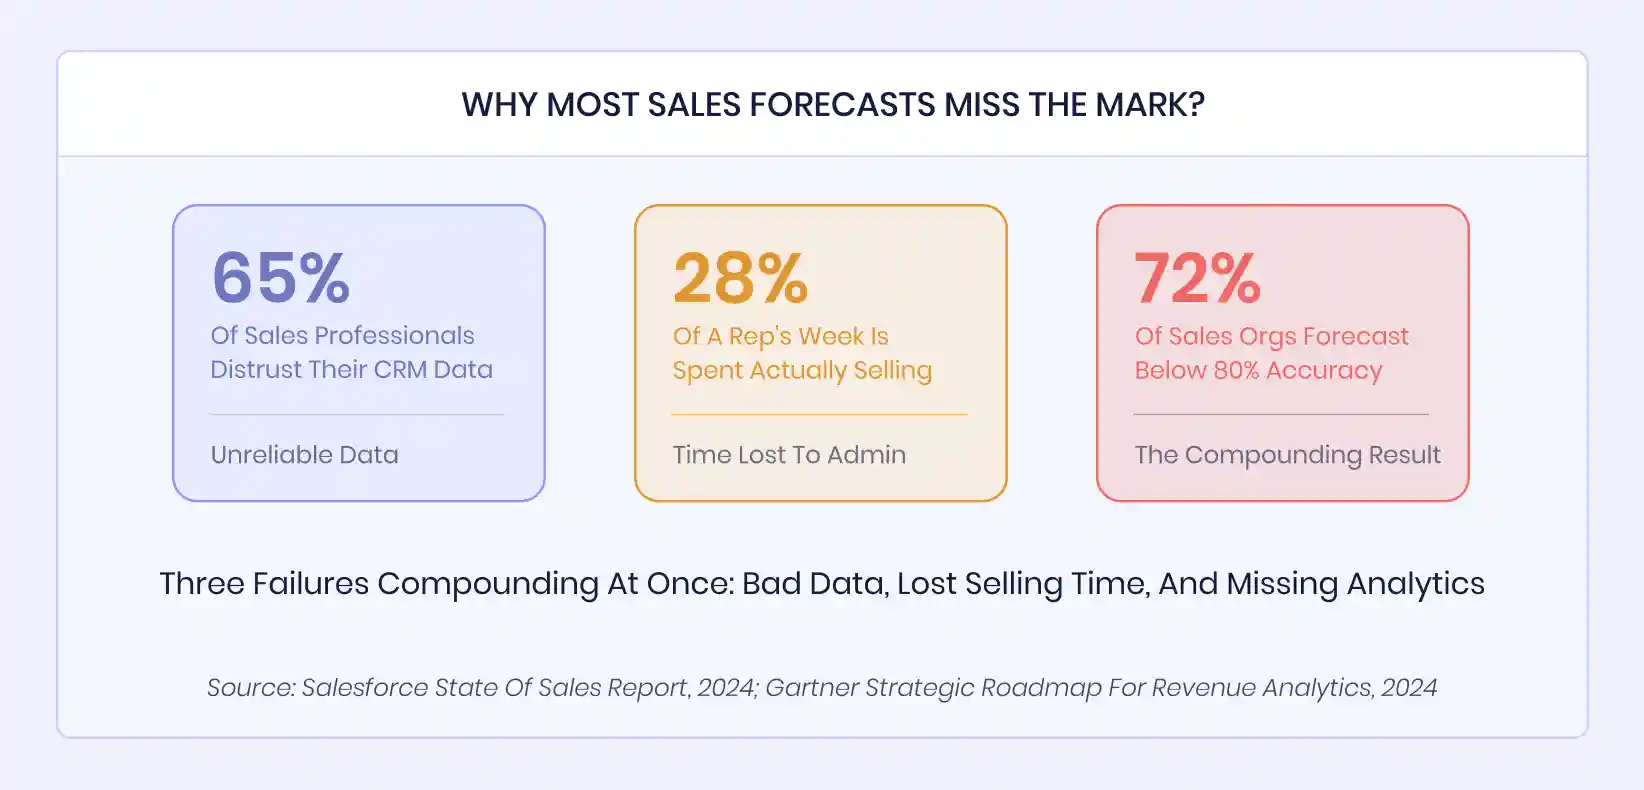
The root cause is not a single failure. It is three failures compounding at once.
CRM data is unreliable: only 35% of sales professionals completely trust the accuracy of their pipeline data (Salesforce State of Sales Report, 2024). When reps do not consistently update deal stages, close dates, or engagement notes, every roll-up built on that data inherits the error.
The process itself consumes time that should be spent selling: sales reps spend only 28% of their week on revenue-generating activities, with forecast preparation and reporting consuming a significant share of the remainder.
And most critically, the analytical layer is missing. Most forecast processes surface a number, not a diagnosis. They tell you what the pipeline totals. They do not tell you where the number is at risk, why it shifted, or what to do about it.
How Should Sales Teams Evaluate Sales Forecast Accuracy Tools?
A modern forecasting system must deliver five capabilities that separate forecast intelligence from repackaged CRM reporting:
Hierarchical aggregation across reps, teams, regions, and the organization without manual roll-up work. Automated identification of specific, named risks rather than a single confidence score. Pipeline movement tracking that shows how deals shift between forecast categories over time. Prescriptive next actions tied to the actual state of the pipeline. And automated report generation that eliminates the weekly build-pull-compile cycle.
Any tool that lacks these five is a reporting dashboard with a forecast label.
How Aviso's Forecast and Insights Agent Improves Sales Forecast Accuracy
You start by selecting the organizational hierarchy (region, team, or individual rep) and the fiscal period. The agent then analyzes the underlying CRM data and produces a structured diagnostic organized into six sections.
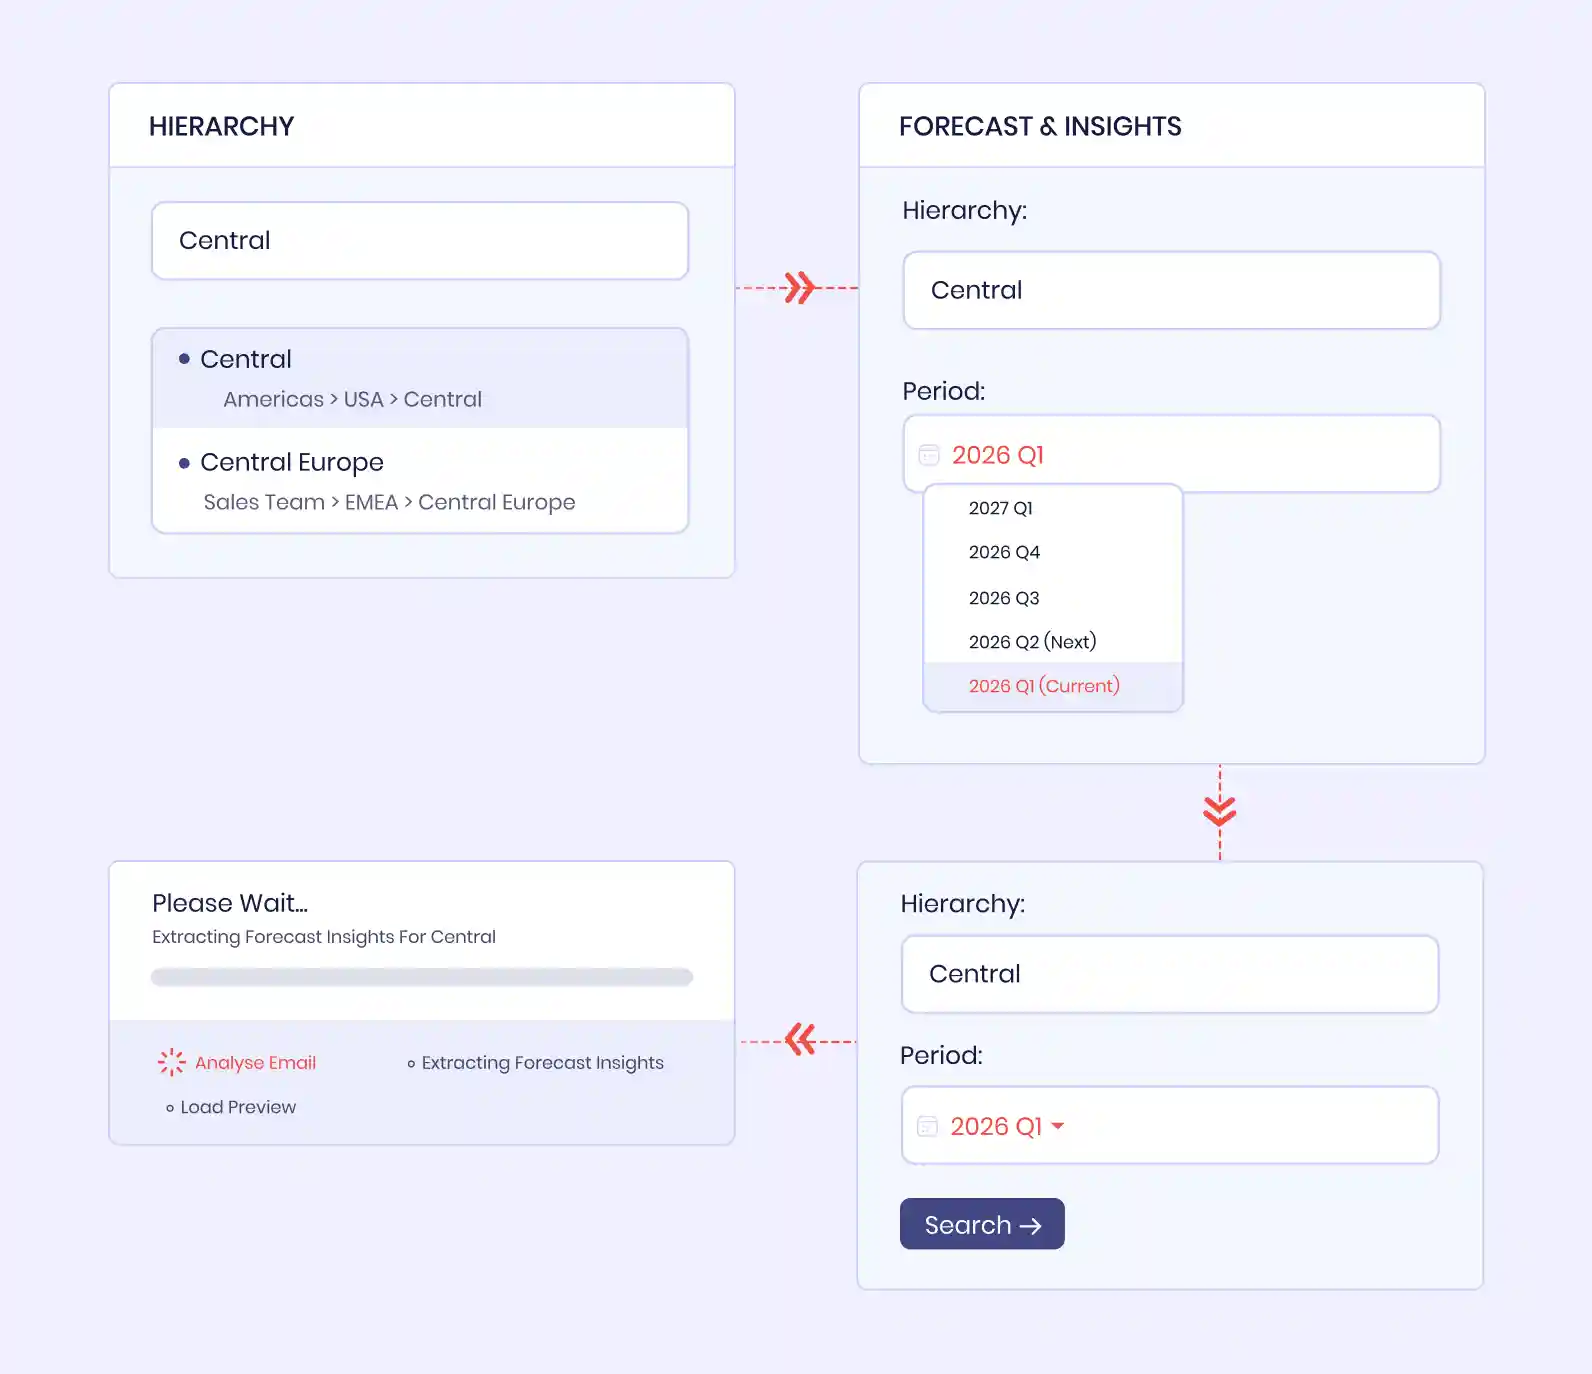
It embeds directly into existing CRM dashboards, syncs data in real time, and exports to executive presentation formats, so the insights live where your team already works. No queries to build, no exports to compile, no pivot tables to maintain.
Quarterly KPI Overview
The first thing you see is a set of KPI cards: Total Quota, Aviso Forecast (the AI-generated prediction), Your Commit, Team Commit, and DLF Total, each with percentage change indicators. The gap between quota, the AI forecast, and the team's committed number is visible immediately, so you walk into the forecast call knowing exactly where the delta sits.
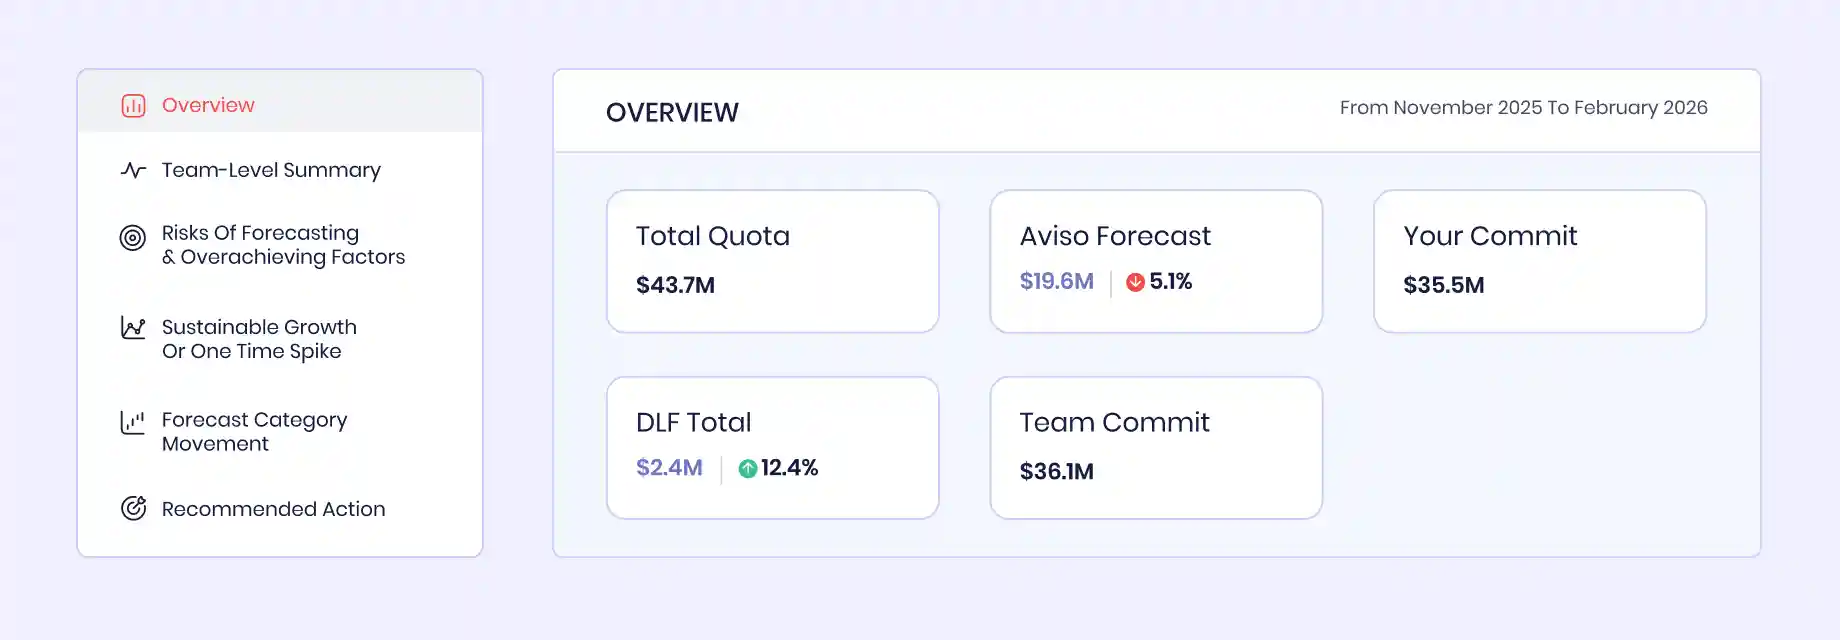
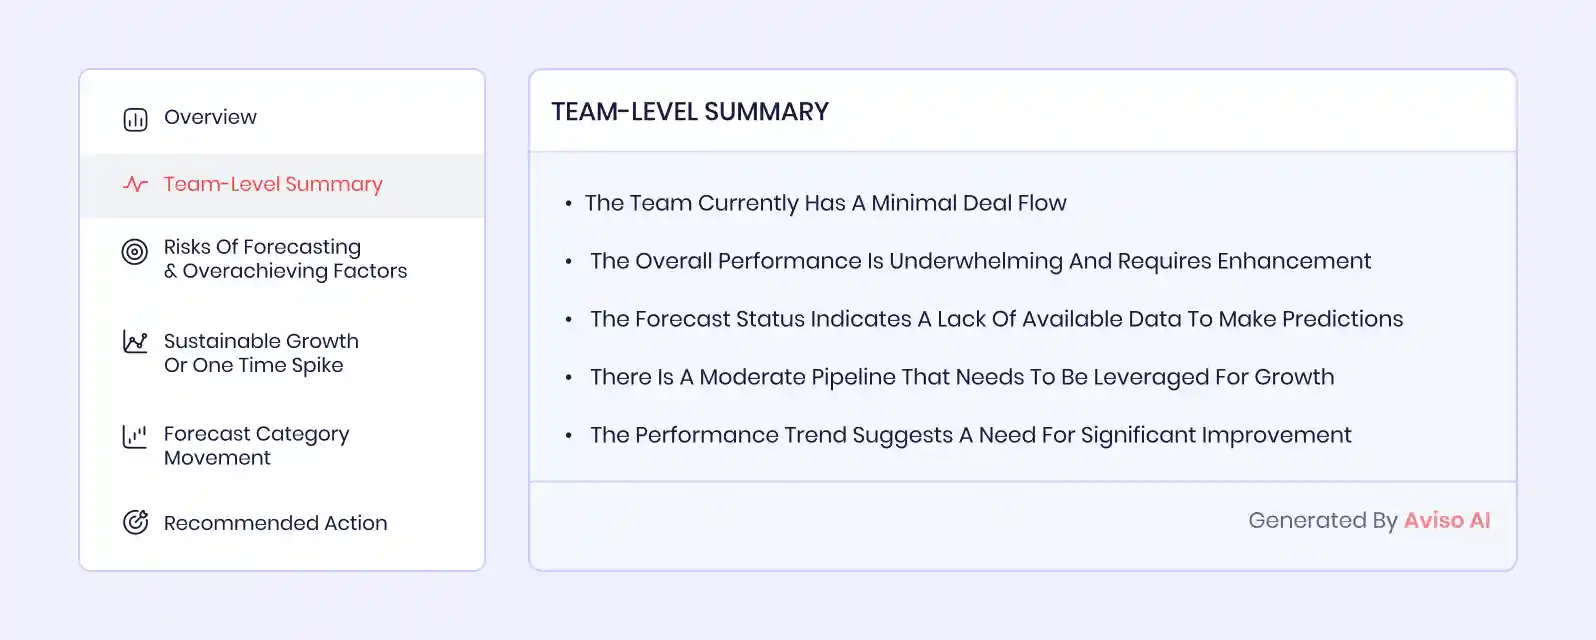
Below the cards, the Team-Level Summary gives you the narrative: total deal count, average deal value, pipeline coverage ratio, and a plain-language performance trend. These are the talking points for leadership, generated without manual compilation.
Forecast Risk Identification
This is where the agent moves from descriptive to diagnostic. Instead of a single "pipeline health" score, you see specific, named risk categories: Low Coverage Risk, Small Deal Size Risk, Stage Concentration Risk, and Performance Trend Risk. Each one includes a severity-level explanation of what it means for the quarter and why it matters.
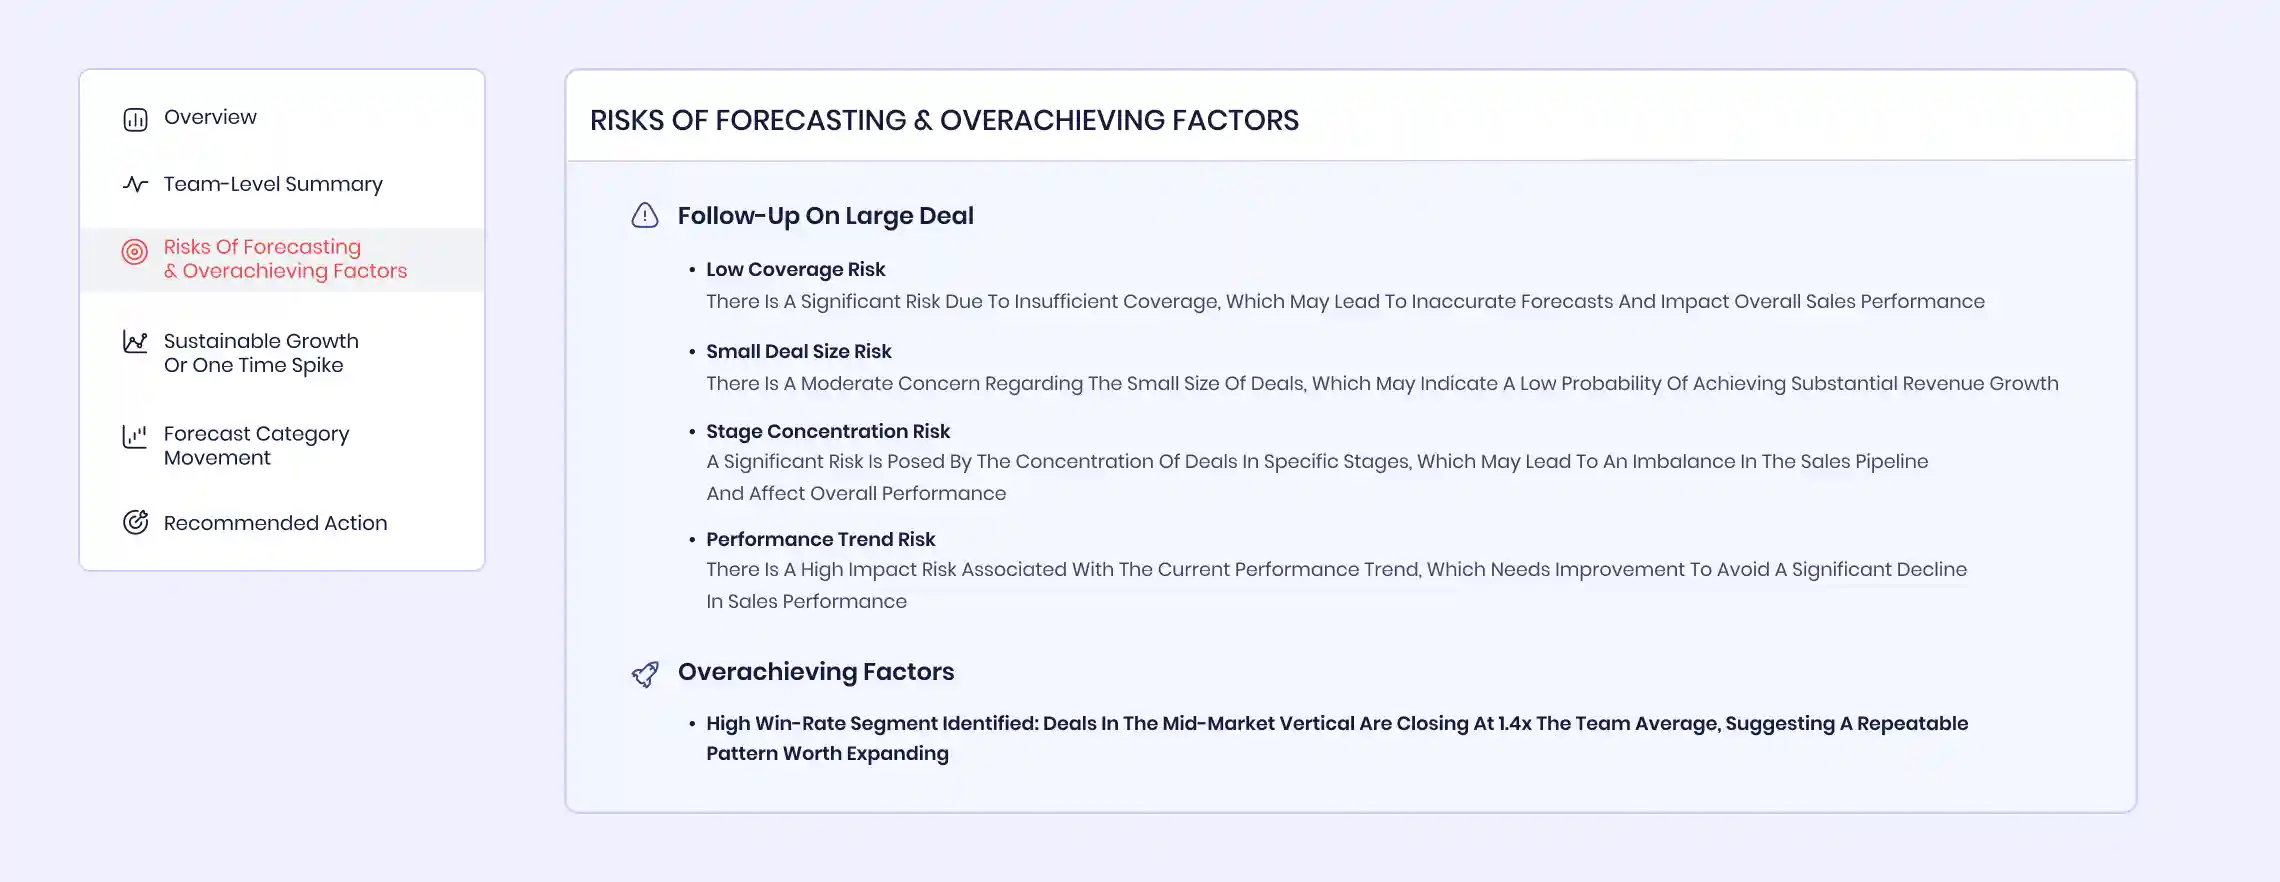
For a sales manager preparing for a forecast review, this section answers the question that generic dashboards leave open: where exactly is my number at risk, and why?
Pipeline Flow Visualization
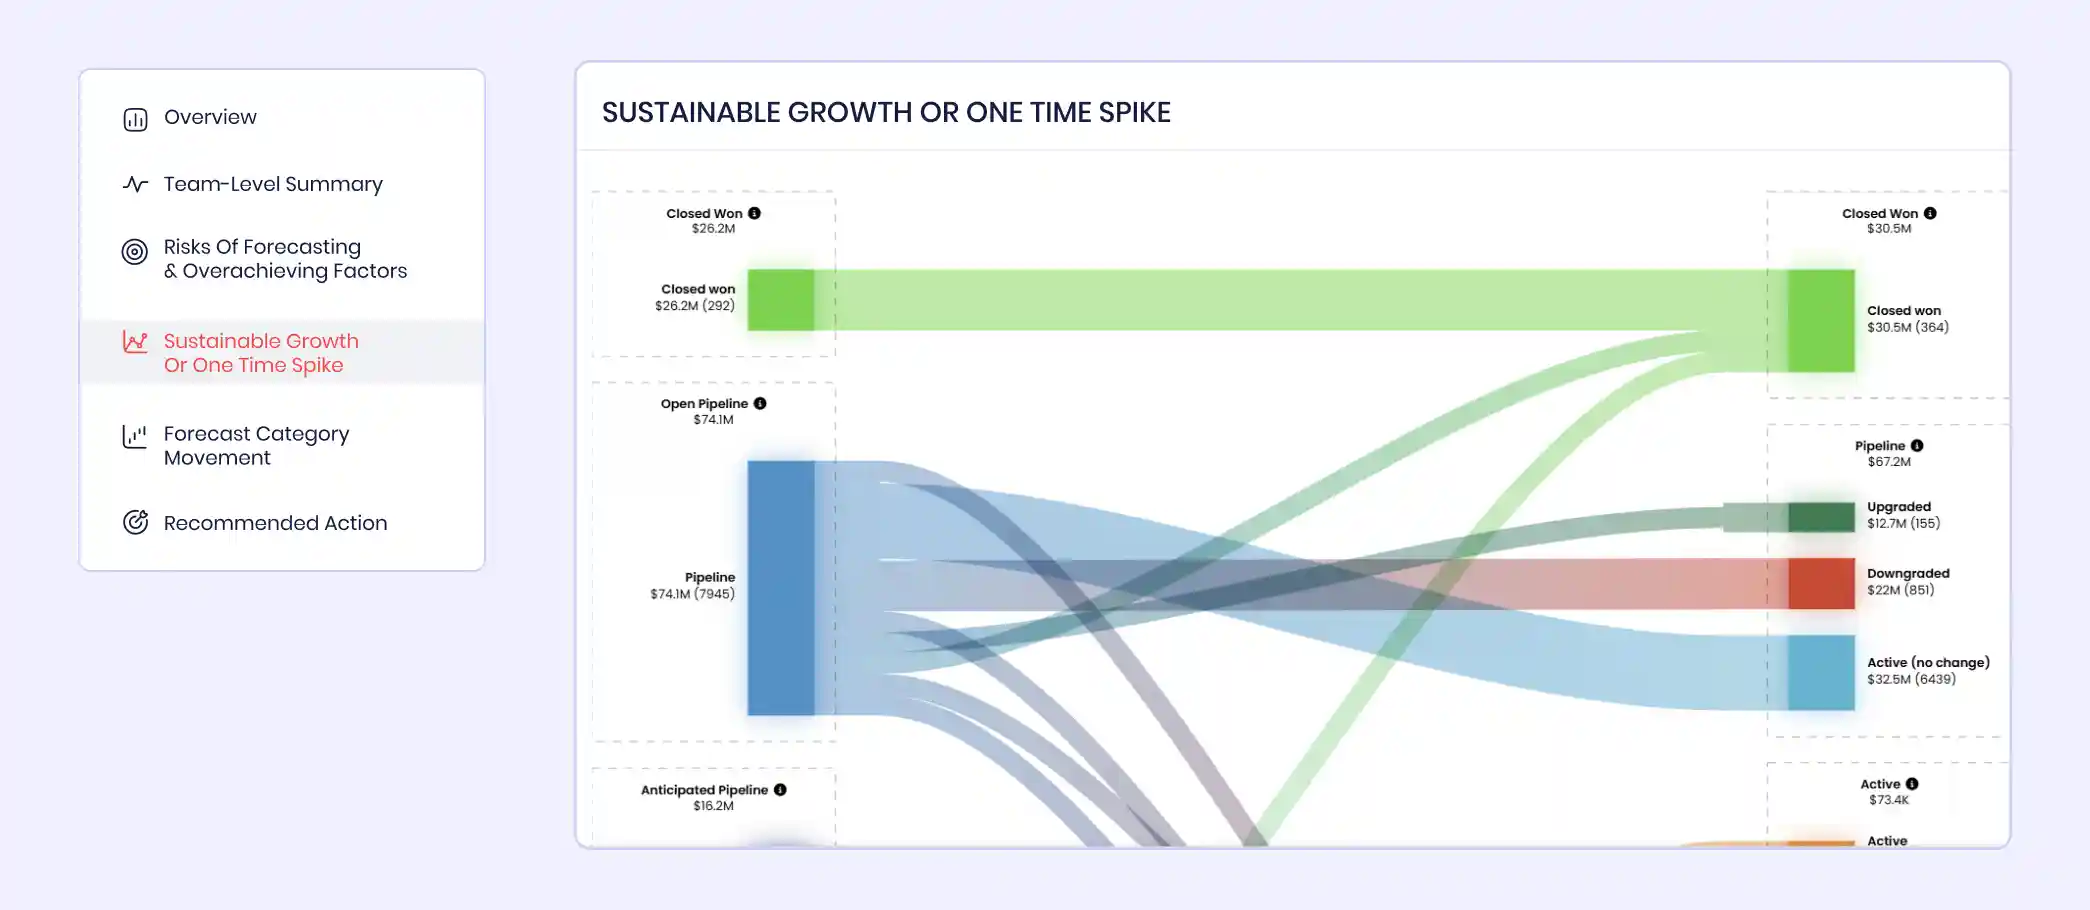
The Sustainable Growth or One Time Spike section presents a Sankey diagram mapping how pipeline value moved across categories during the period.
You can trace flows from Closed Won, Open Pipeline, Anticipated Pipeline, and New Pipeline on the entry side through to Upgraded, Downgraded, Active (no change), and Active (new) on the exit side, with dollar values and deal counts on each flow.
Alongside the Sankey view, you can access quarterly forecast charts that overlay current projections against historical trend lines, so the pattern recognition that typically requires a separate BI tool happens within the same workflow.
This answers a question that point-in-time snapshots cannot: is the pipeline growing through consistent deal creation and progression, or did one large close mask underlying stagnation?
For revenue leaders evaluating whether a quarter's result is repeatable, this distinction determines whether the next quarter starts from strength or from a coverage deficit.
Forecast Category Movement and Recommended Actions
The Forecast Category Movement section breaks down deal-level transitions: which deals moved from Upside to Commit, which slipped from Commit to Best Case, and where qualification risk is highest.
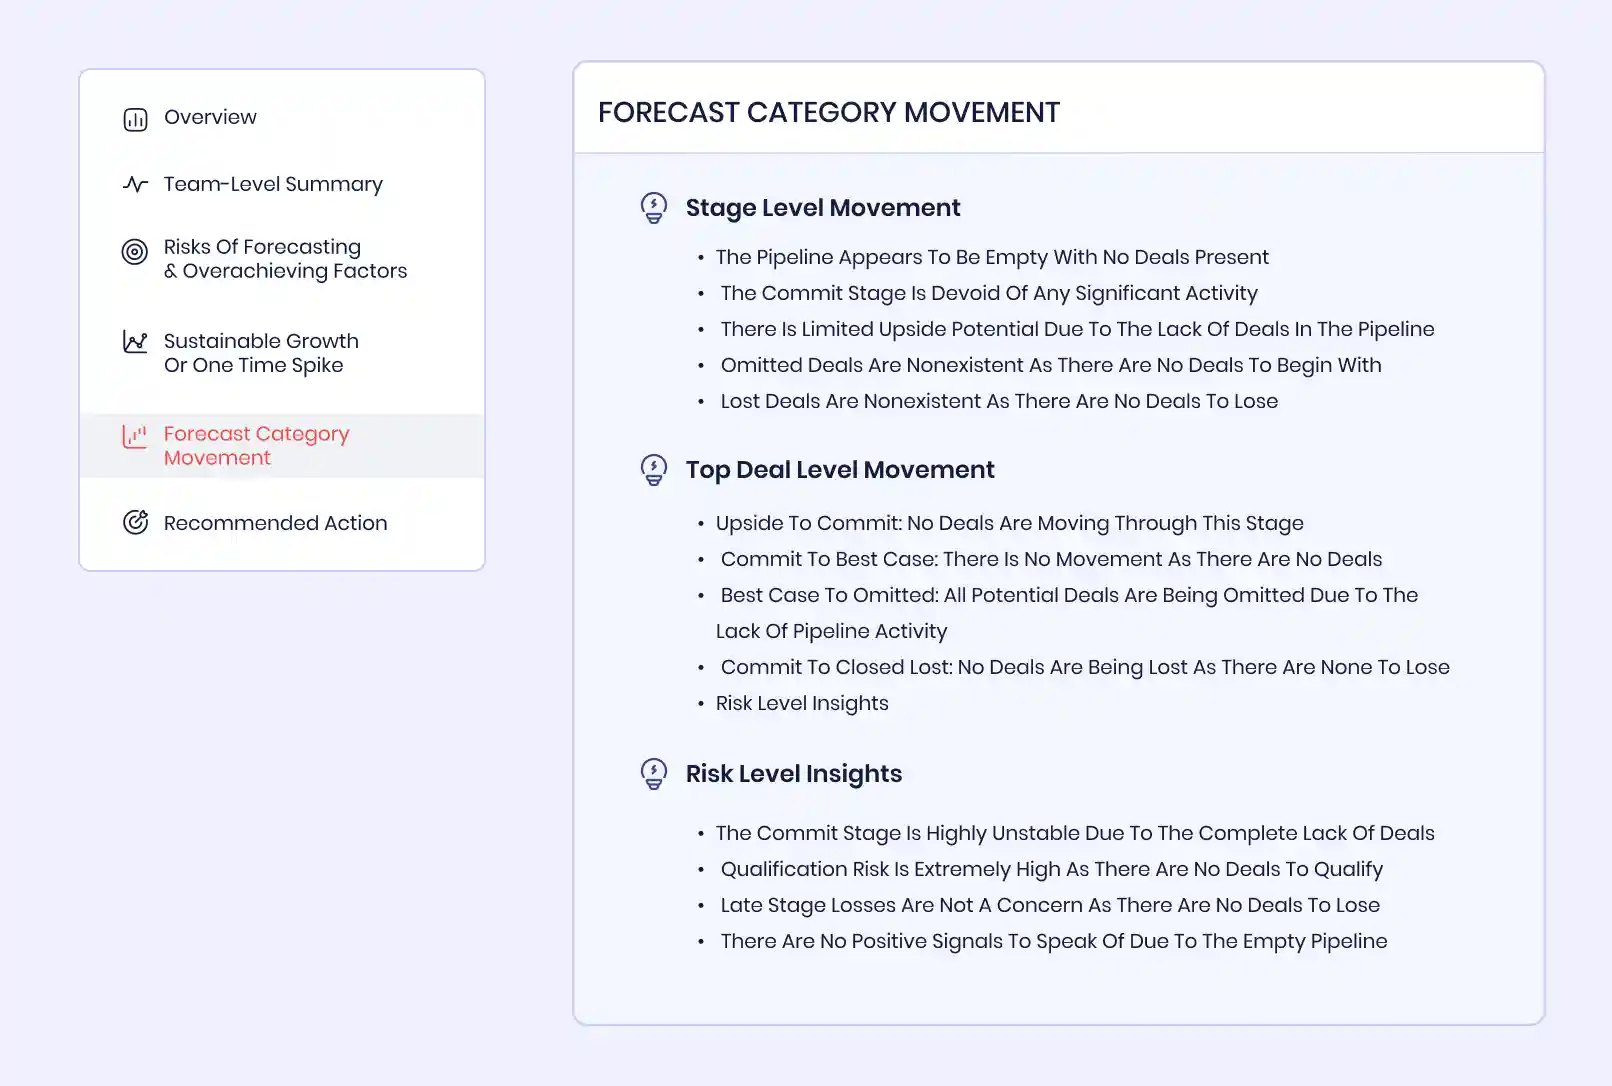
Stage Level Movement, Top Deal Level Movement, and Risk Level Insights are structured as subsections, giving you a prioritized view of where coaching attention will have the most impact.
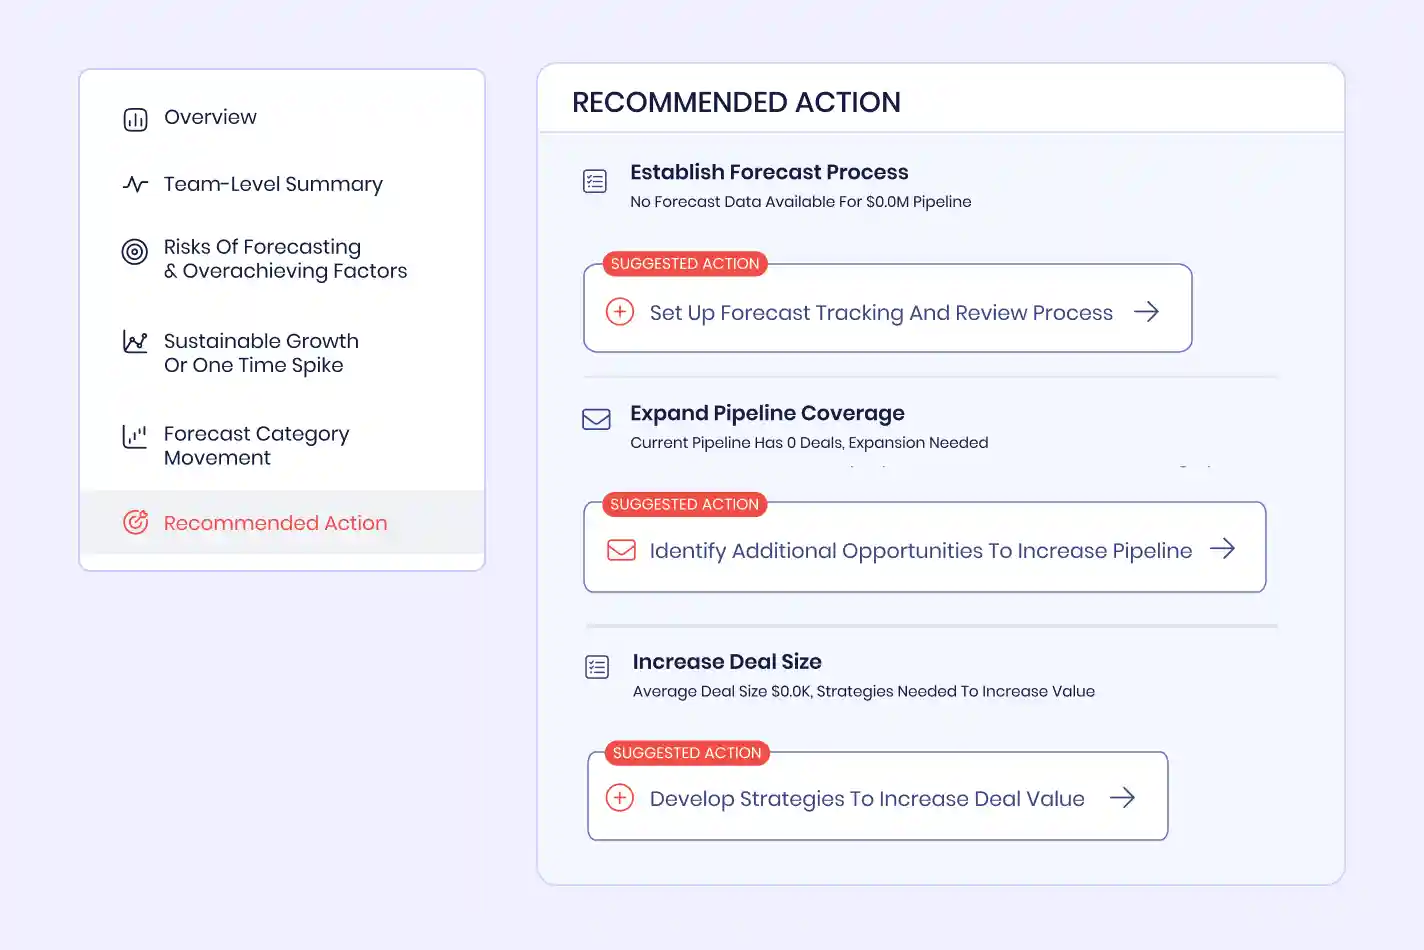
The Recommended Action section translates the full analysis into specific next steps. These are not generic suggestions.
Each card references the actual pipeline state that triggered it.
You walk away from every forecast review with a documented action plan, not just a set of numbers to interpret. Each of these six diagnostic sections can also be delivered as a scheduled report, so leadership receives updated forecast intelligence without anyone building, pulling, or compiling it manually.
What Improvement Can Sales Managers Expect from AI-Driven Sales Forecast Accuracy?
The operational gain concentrates in two areas.
First, the hours you previously spent compiling forecast data from CRM exports and spreadsheets are eliminated by the agent's automated generation.
Second, the quality of your forecast conversations improves when every participant is working from the same AI-generated risk analysis rather than individually assembled views.
For revenue leaders, the value is in predictability: when pipeline risks are named, quantified, and tracked across quarters, the forecast stops being a negotiation exercise and becomes an analytical one.
Moving from Forecast Guesswork to Forecast Intelligence
The gap between a forecast number and a forecast process is analytical infrastructure: the ability to aggregate, diagnose, visualize, and prescribe at the speed that quarterly business demands. Sales managers who build that infrastructure now will find that the Sunday-night forecast anxiety starts to look less like an inevitability and more like a solved problem.
See how Aviso's Forecast and Insights Agent generates pipeline risk analysis for your team's current quarter. Book a demo.
FAQs
Q - What is sales forecast accuracy and why does it matter?
Sales forecast accuracy measures how closely predicted revenue matches actual closed revenue for a given period. Inaccurate forecasts lead to misallocated resources, missed hiring windows, and eroded credibility with the board. According to Gartner's 2024 research, 72% of sales organizations report forecast accuracy below 80%.
Q - How can AI improve sales forecast accuracy?
AI improves forecast accuracy by analyzing historical deal outcomes, current pipeline signals, and engagement patterns to generate predictions less susceptible to human bias. It also eliminates the manual data compilation that consumes selling time and introduces errors into the forecasting process.
Q - What is the difference between a sales forecast tool and a reporting dashboard?
A reporting dashboard displays historical and current pipeline data, requiring the manager to interpret patterns. A forecast tool applies analytical models to predict outcomes, identify risks, and recommend actions. Reporting tells you what happened; forecasting tells you what is likely to happen and where to intervene.
Q - What pipeline risks should sales managers monitor during forecast reviews?
Sales managers should monitor pipeline coverage ratio, stage concentration, deal velocity trends, average deal size relative to target, and forecast category movement. Each of these indicators signals whether a forecast is achievable or at risk before the quarter closes.
Q - How often should sales teams review forecast accuracy?
Sales teams should compare predicted versus actual results at the end of every fiscal period, broken down by rep, team, and region. Weekly pipeline reviews during the quarter should track leading indicators like deal movement and coverage changes, enabling mid-quarter corrections rather than post-mortem analysis.