Sales Leaders, Simplify & Analyze Data Instantly with NLP Analytics

No time to lose? Summarize with AI
ChatGPT
Claude

Technology is only successful when it can solve complex business problems with advanced yet user-friendly solutions. The same is true for analytics in B2B sales.
Too often, sales analytics projects fail because Sales and RevOps leaders end up implementing complicated solutions that require coding expertise. As a result, they have to rely on analysts to run forecasts or resort to less advanced and time-intensive tools like spreadsheets to prepare reports for business review meetings.
Enter NLP Analytics
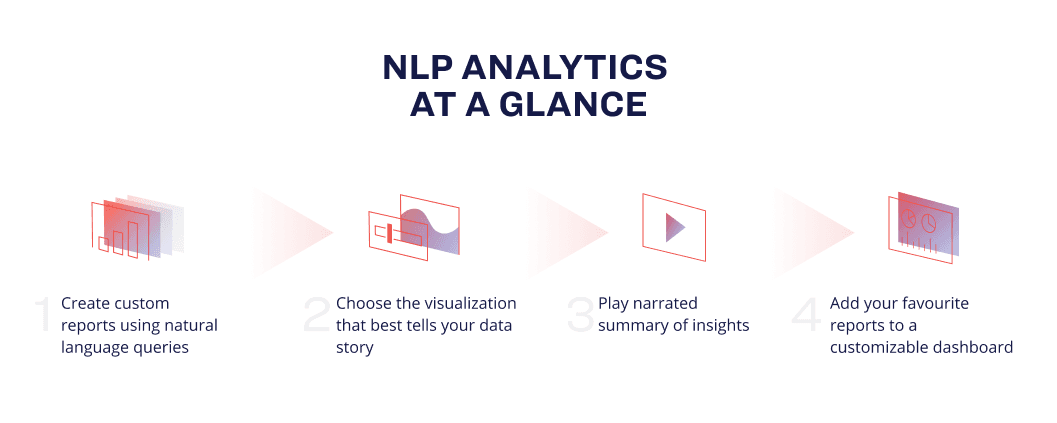
As the name suggests, NLP analytics is a business intelligence (BI) approach that empowers non-technical users to explore and analyze data without the need for IT or BI specialists. Thanks to natural language processing (NLP), it has made analytics more accessible by eliminating the need to understand SQL.
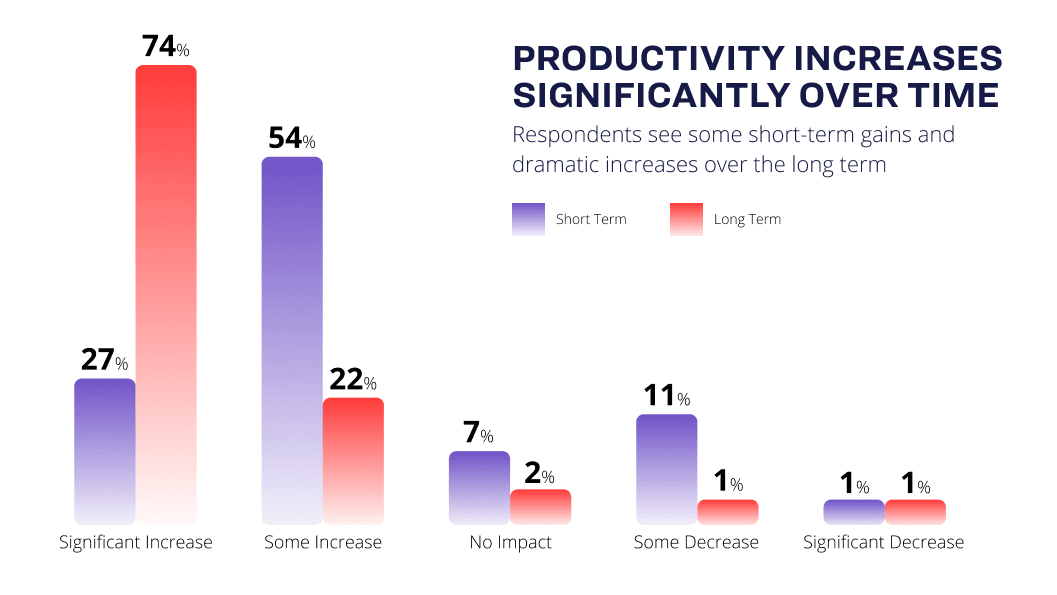
World-class businesses have been leveraging BI tools to gain a competitive advantage over their peers and empower their teams. In fact, a 2020 Harvard Business Review study revealed that 72% of organizations providing their team members with NLP tools and embedded analytics saw a significant increase in productivity.
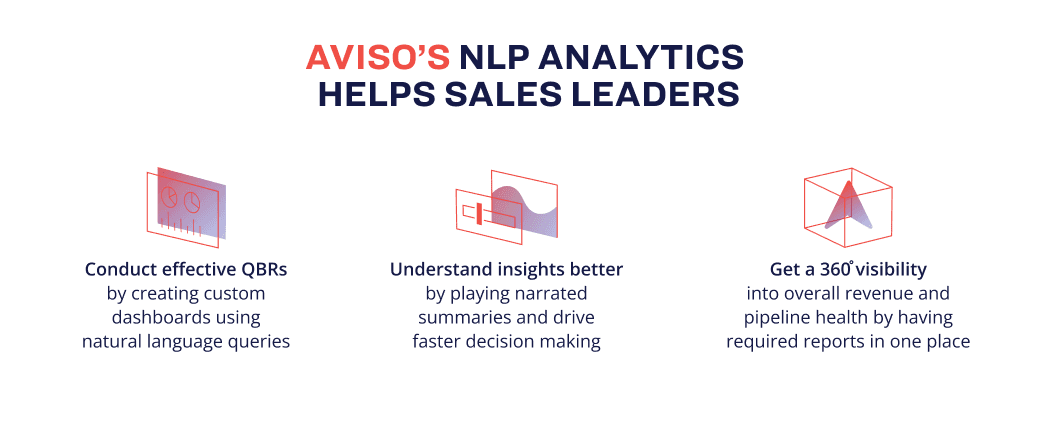
Aviso’s NLP Analytics
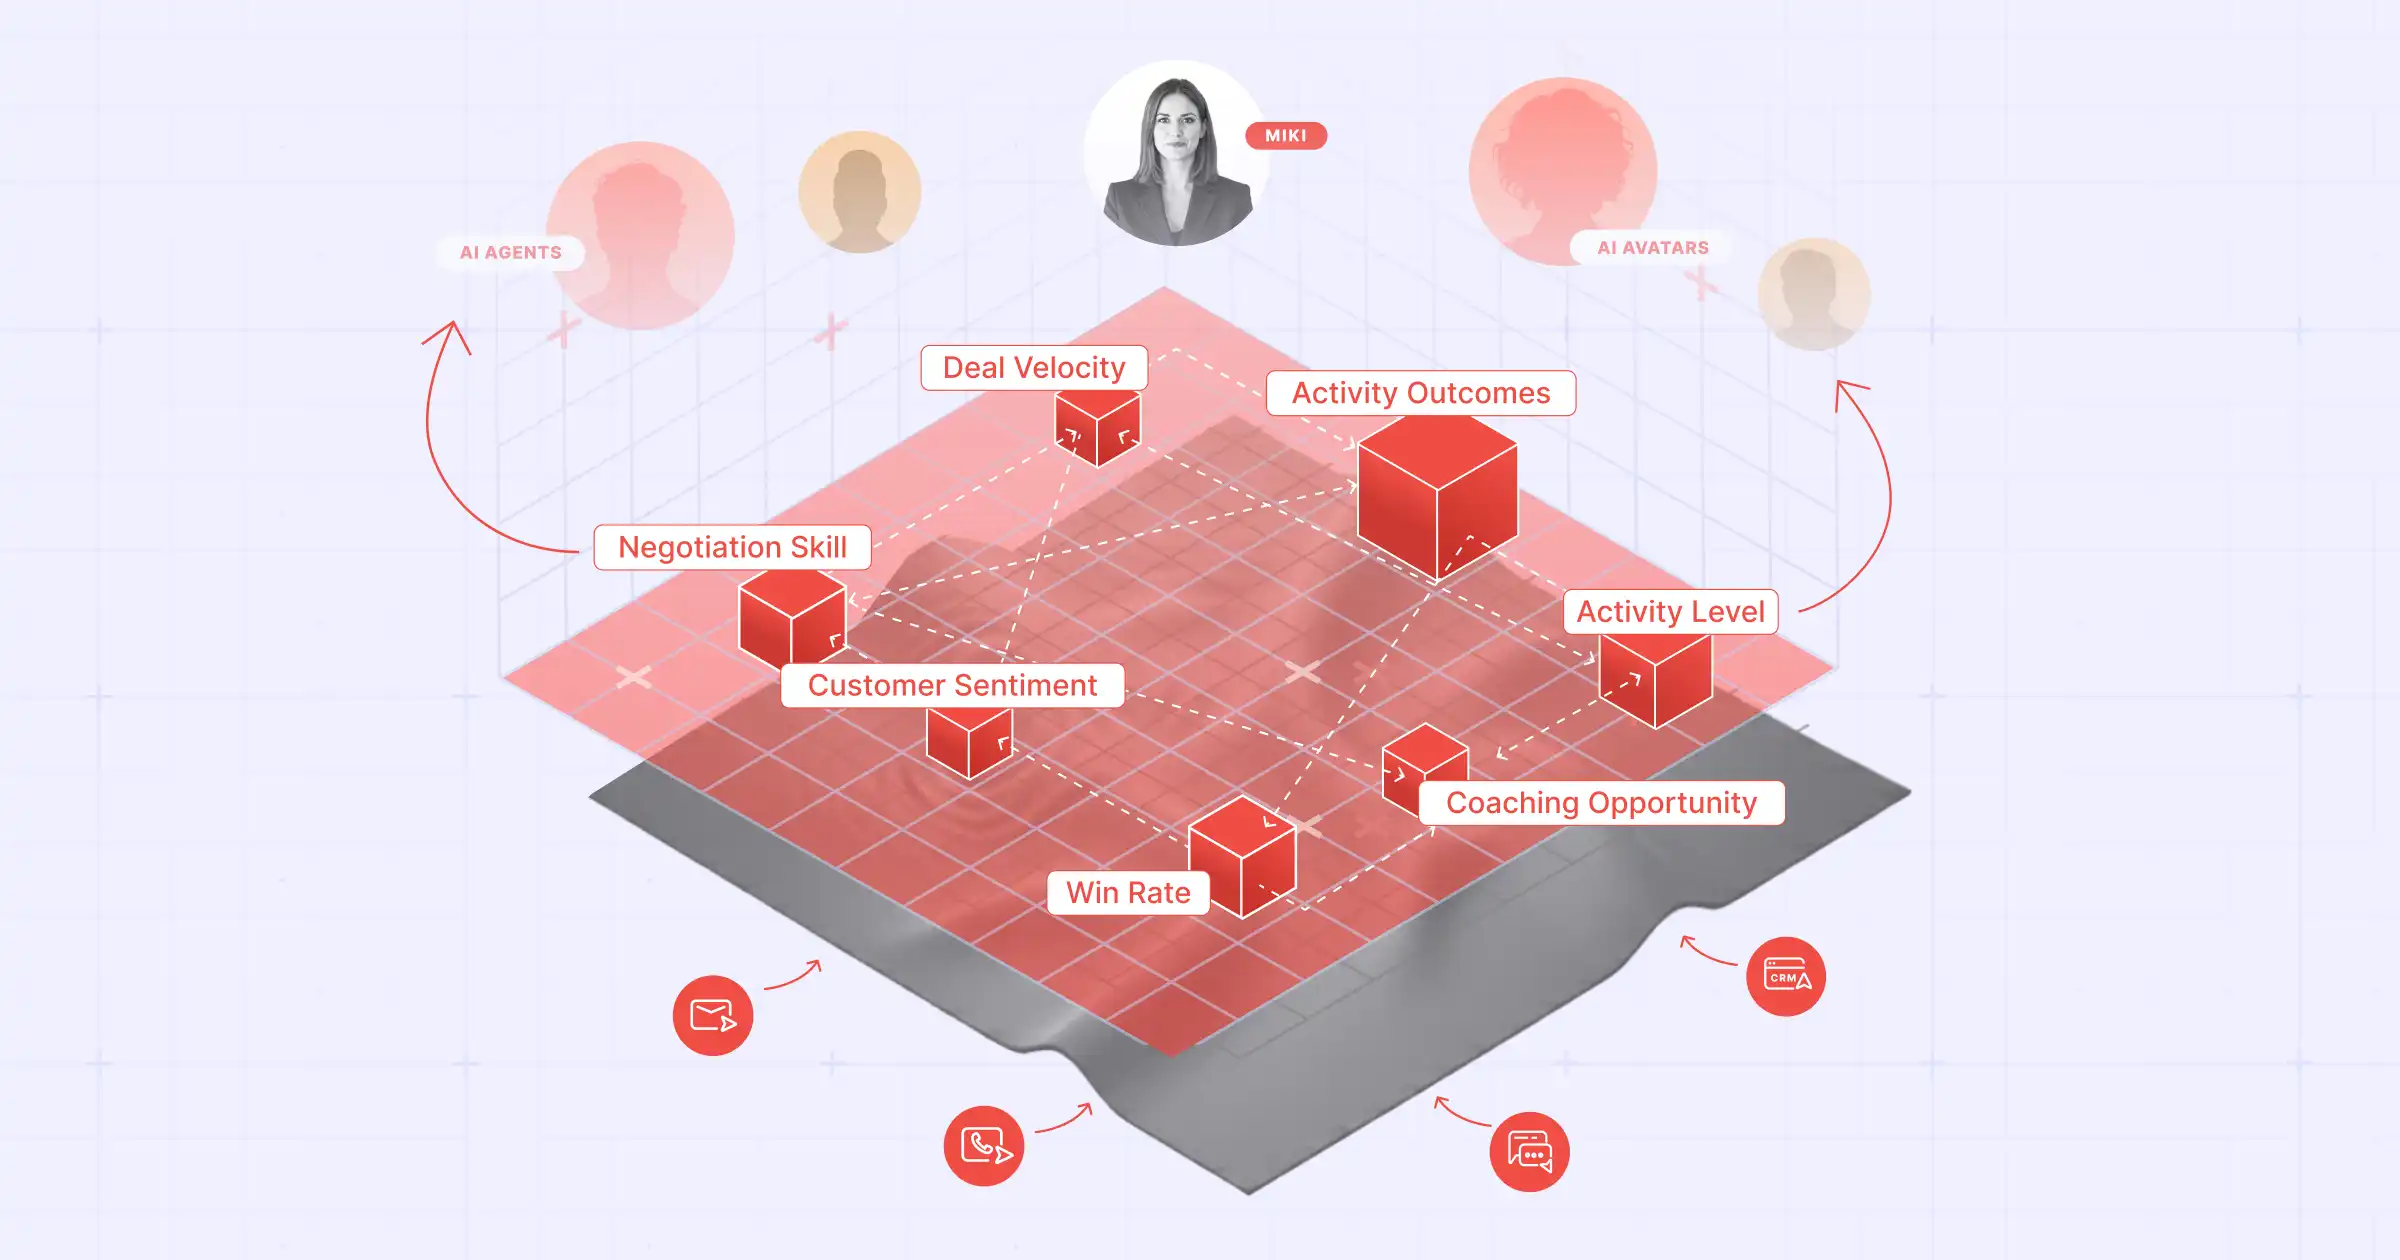
Aviso's NLP analytics is driven by the overarching principle of reducing the time to value for Sales and RevOps leaders. This no-code solution cuts through the layers of the data model, coding, and dependency on BI analysts. It enables sales leaders, reps, and Chief Revenue Officers (CROs) to get deep-dive actionable insights on pipeline and revenue health available at any instant.
Here’s How Aviso’s NLP Analytics Empowers Sales Leaders, CROs & Reps:
1. Scenario - Waiting for the data analyst to create a revenue report you need for an upcoming QBR.
“You have to report to your manager why there's a drop in this quarter's sales. You identified there's an issue in the way data is being reported. You contacted the data analyst to correct the issue and share revised reports. But, the data analyst is busy with many such requests from other teams. The time is running out. What do you do?”
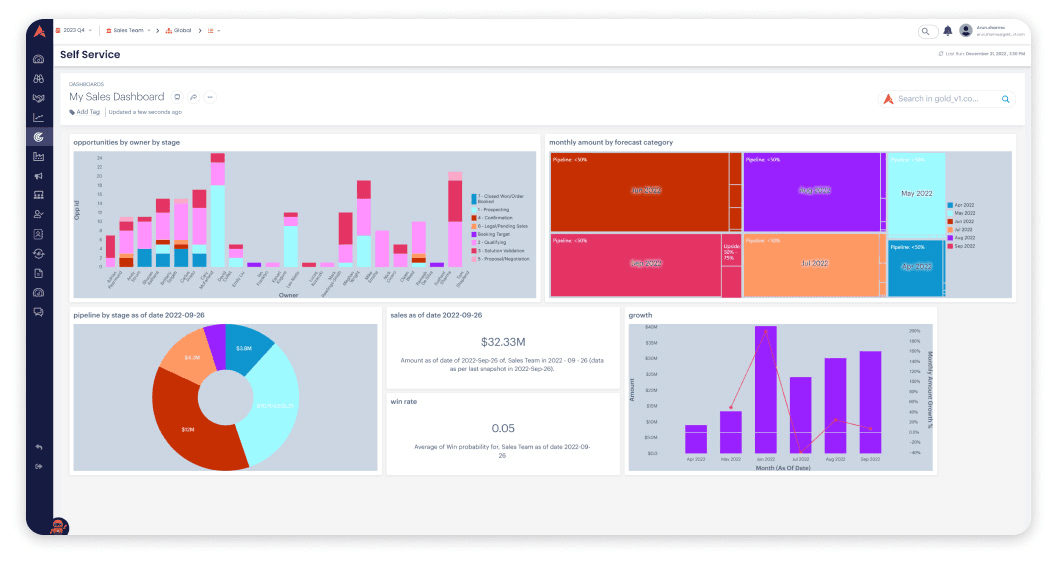
Solution: Create The Report Yourself With Drag & Drop Interactive Charts & Reports
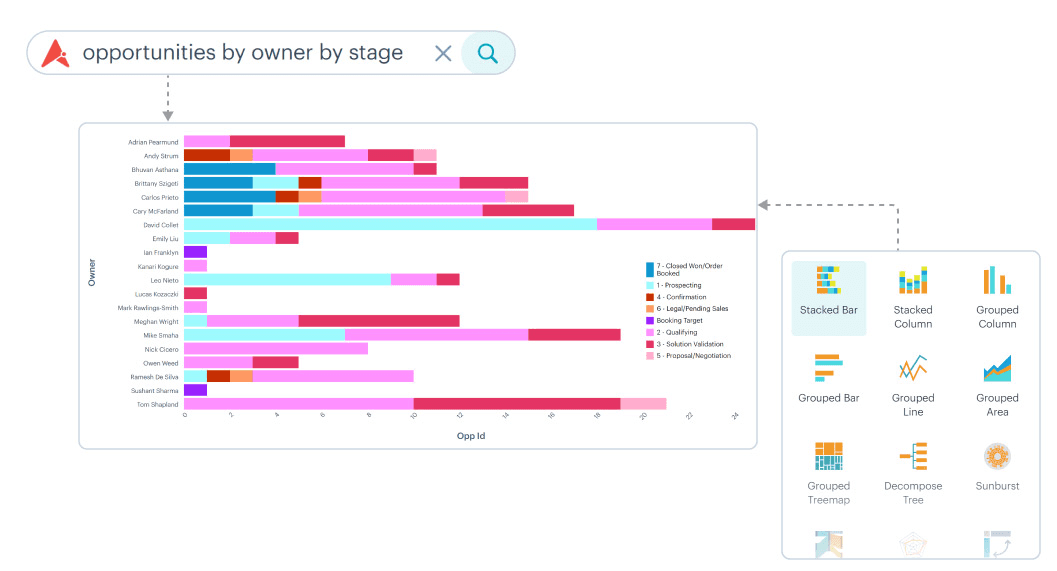
On the NLP analytics platform, simply type a query in plain English requesting a specific report, and the solution will extract data from CRM, forecast, and activity (meetings and emails) and present it in tabular, graphical, and other available interactive visualization formats in accordance with the data and security policies.
Benefits:
Reduced hours spent in finding accurate data manually from multiple customer data sources.
No need to create charts ground up yourself on PowerPoint or spreadsheets.
Building report dashboards is made easy with a click of a button as it requires no pre-requisite coding knowledge.
2. Scenario: The unavailability of a sales rep is causing a major revenue leakage
“A sales rep had to go on an emergency leave unexpectedly. Big deals are assigned to their name that are currently going cold due to inactivity. You must quickly reassign the deals to other reps to avoid losing any ongoing important deals. What do you do?”
Solution: Use Drill-Down Details of an Attribute on any Report
The report generated by the NLP analytics can be delved into deeper item-level information and/or hierarchy-specific information. For instance, you can view the total number of ongoing opportunities handled by each sales rep and at its pipeline stage.
Benefit:
Make quick and more informed decisions with granular pipeline data available.
Conduct better performance reviews by getting visibility into ongoing and completed employee tasks.
3. Scenario: Sales reps spend more time analyzing and making sense of reports.
Most of the sales reps time is spent evaluating complex and multiple reports. This is causing them to spend less time strategizing for the next sales call. How do you tackle this problem?
Solution: Graphical Insights from the Report Summarized in a Short Video.

At the hit of a button, the system plays a video explaining complex reports in a simplified and concise manner.
Benefits:
Improved rep productivity and increased data literacy.
Higher user adoption due to the ease of working with the solution.
4. Scenario: Data silos, duplicate and inconsistent records causing confusion.
A sales rep marked a deal closed-lost on the CRM; however, the status was not updated on other records. This caused an erroneous forecasting report. How do you fix it?
Solution: Dashboards that Act as a Single Source of Truth
The user can create dashboards and pin the reports under a desired dashboard per the requirement. For instance, a dashboard named QBR can have reports on win rate, sales cycle time, commit deals accuracy, pipeline conversion rate, etc. The dashboard can also be shared with the team to bring them up-to-speed faster about a specific report.
Benefit:
Organize your reports under one roof for future reference.
Collaborate better with your sales reps with common available data across the board.
Conclusion
Technologies like natural language processing (NLP) and generative AI will continue to make analytics interpretable and more accessible to non-technical users. Sales and RevOps leaders must embrace BI analytics to empower their teams by addressing potential skills gaps. This, in turn, will allow room for better collaboration, streamlined business processes, and improved customer service.
Interested to know how Aviso NLP Analytics can empower your business? Book a demo now!