Zoom 2x into Pipeline Progression with Multi-Level Sankey Charts

No time to lose? Summarize with AI
ChatGPT
Claude

Limitations of Traditional Single-Level Sankey Charts
In the realm of sales pipeline analysis, traditional single-level Sankey charts have played a valuable role in visualizing the flow between two critical points, usually spanning months within a given timeframe. However, they often leave us craving a more detailed perspective on the pipeline's dynamics during shorter intervals, such as weeks or quarters. In today's turbulent economic landscape, having a laser-focused view of the journey of high-stakes deals at every step is paramount to safeguarding your business's revenue.
Aviso’s Multi-Level Sankey Charts
Enter Aviso's Multi-Level Sankey Charts. These charts empower revenue leaders to simultaneously dissect pipeline activity across multiple timeframes, whether weeks, months, or quarters. With these charts, you gain insights into how deals progressed through the sales forecast and precisely identify where they stand - whether omitted, committed, or marked as best-case scenarios.
Multi-Level Sankey Charts help answer the most commonly asked questions by revenue execution teams:
Where are we encountering the most deal attrition, and how can we address it effectively?
What is the current win rate for our late-stage opportunities, and how can we improve it?
What changes have occurred in the pipeline throughout the quarter, from beginning to middle and end?
How has the pipeline evolved monthly within the quarter, and what can we learn from these fluctuations?
What has become of our committed deals across multiple quarters, and what trends can we discern?
How are deals from the previous quarter advancing through each stage in the current quarter?
What is the trajectory of last quarter's discovery deals, and where do they stand in the current quarter?
Key Capabilities
1. Track Pipeline Progression by Forecast Categories Across Multiple Timeframes
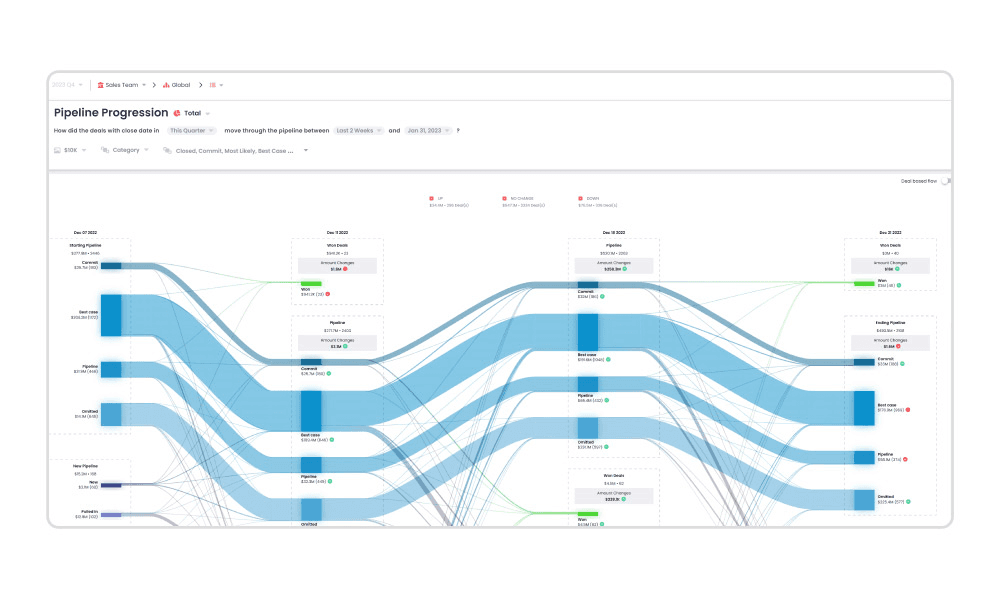
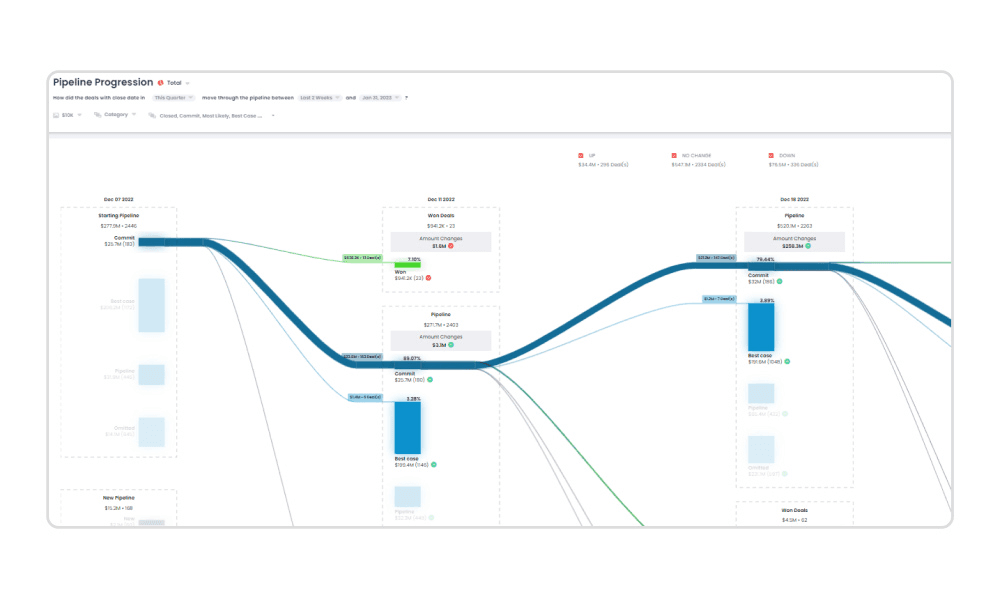
Within Aviso's Analytics module, our Pipeline Progression function allows revenue leaders to meticulously monitor revenue generation across multiple timeframes, months, weeks, or quarters. These charts facilitate tracking status changes for deals placed in various forecast categories. Easily navigate through each category to dive deep into the deals it encompasses, review the actions that have transpired within those deals, and develop strategies to address any challenges.
For example, the chart below provides a clear visual of the commit deals' progression, identifying those advancing, stagnating, or slipping between December 7th, 11th, and 18th.
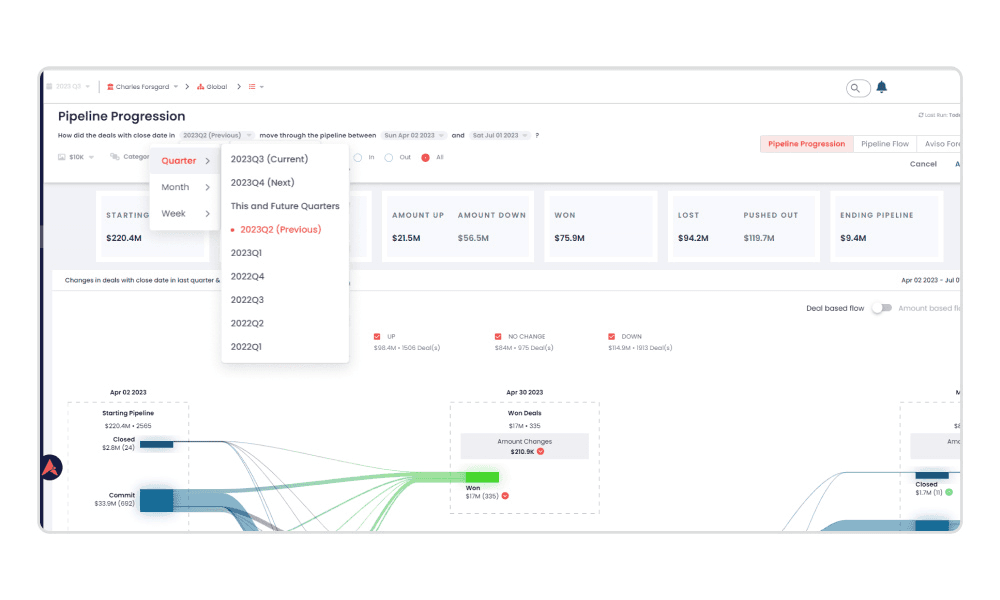
2. Study Deals from the Past Six Years
Furthermore, with our Multi-Level Sankey Charts, users can access historical deal progression data spanning a generous six-year period. This historical dataset offers a comprehensive view of how developments have unfolded week by week over an extended timeframe.
Such a wealth of historical information proves invaluable for business leaders seeking to discern patterns and anomalies within their operations. It serves as a valuable resource for understanding the nuances of their business landscape, particularly when identifying trends in deal delays and assessing what constitutes standard practice versus what stands out as exceptional.
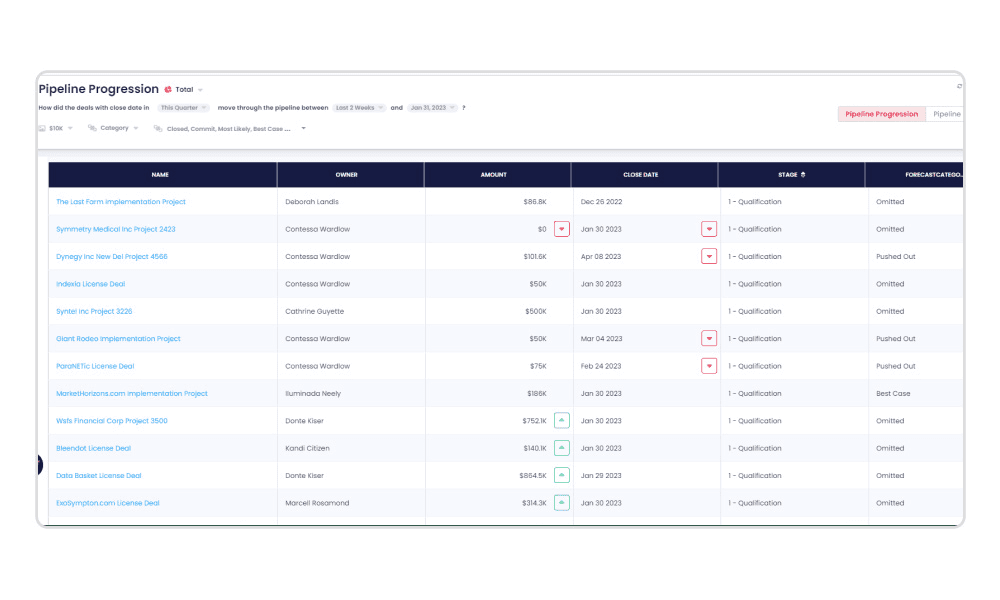
3. Drill-Down View Inside Deal Information
Aviso provides revenue leaders with a powerful tool to delve into the heart of their deal information, effortlessly accessing a wealth of data, including a detailed list of all deals within their pipeline, deal ownership, current deal stage status, forecast category status, and updates on close dates (whether they've been delayed or accelerated), along with any changes in deal amounts. Begin by reviewing the current status of each deal and gaining a high-level overview of your pipeline's health. Then, take a deep dive into the intricate details of each deal, tracking engagement and activity associated with every opportunity.
This level of insight empowers managers and leaders to achieve a crystal-clear understanding of their pipeline's dynamics. By leveraging this robust information, you can pinpoint areas for improvement and capitalize on your team's strengths, resulting in enhanced sales efficiency, smarter decision-making, and a more streamlined path to revenue growth. With Aviso, you're equipped to drive success through data-driven insights.
Conclusion
In summary, Multi-Level Sankey Charts help track pipeline progression better by allowing granular visibility into pipeline movements happening over multiple weeks, months, or quarters as opposed to Single-Level Sankey, which shows pipeline movement between two reference points only. This, in turn, enables better decision-making, scenario planning, and identifying improvement areas, and addresses gaps where deals are lost to ensure you meet your sales forecast.
Want to enable precision pipeline tracking for your business? Schedule a demo today.


